Muddy Points
Lesson
Muddy points from Winter 2024
1. Relationship between distributions
Just to clarify! We will be using the distributions in the context of hypothesis testing. I just wanted you to see some of the cool connections between the distributions. (We don’t need to know the connections for a lot of what we do in this class.)
Also, I will discuss each distribution again as we hit the hypothesis tests that use them!
There is a big, scary (but fun!) infographic at the end of a famous stat textbook (Casella and Berger) that shows all the connections between distributions:
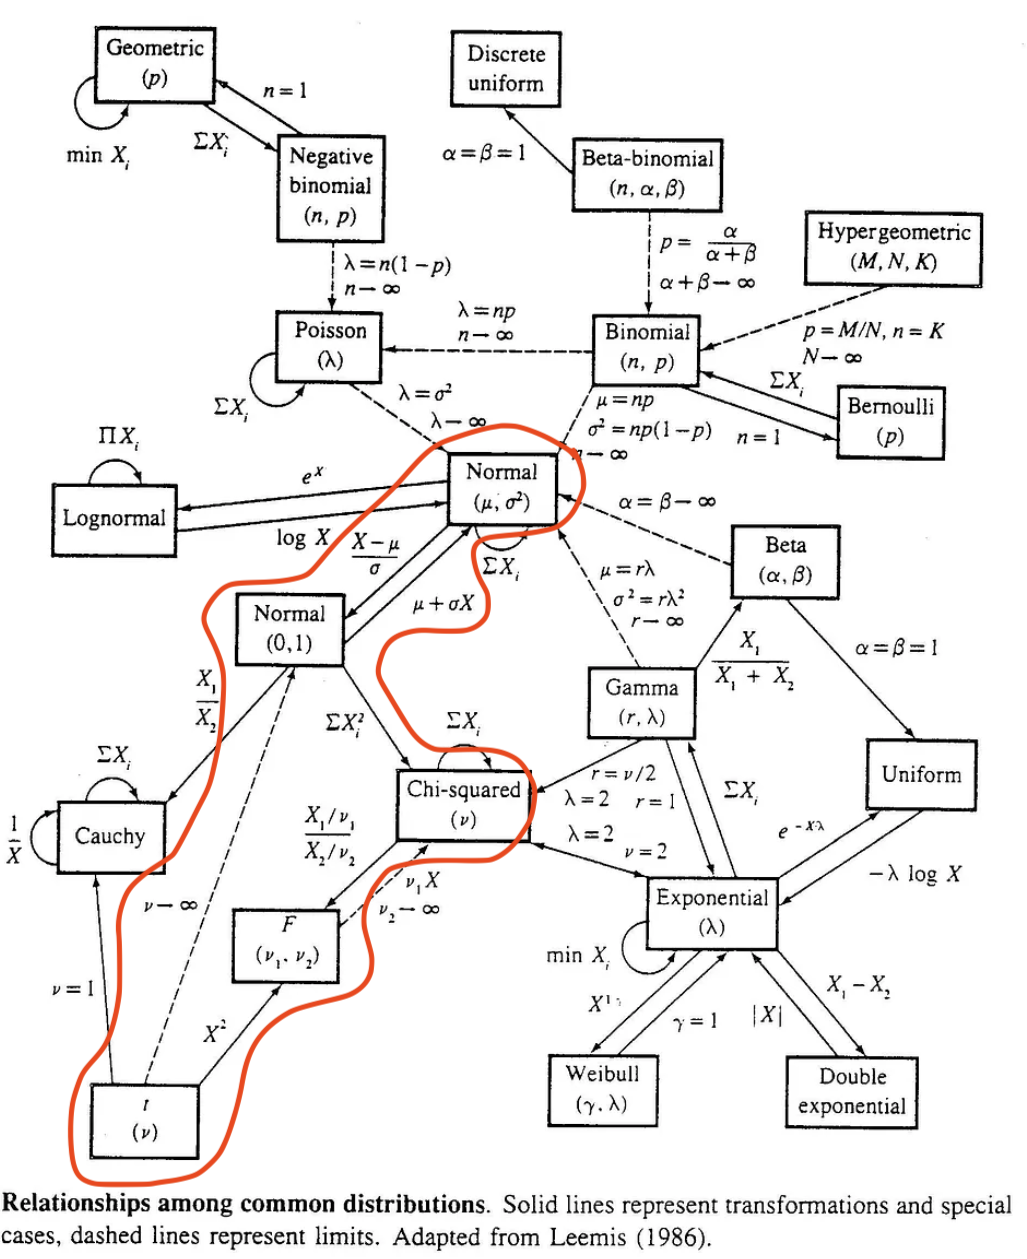
We mostly talk about the red, circled area. Each line with the directional arrow represents a specific transformation that is needed to go from the starting distribution to the distribution at the end of the arrow.
Again, this is NOT information we need to perform regression, but it is really interesting to see the connections between these distributions.
2. A word about the distributions
I feel like I might’ve scared us with all the distribution talk.
I want to be clear: We will further discuss and explore the distributions as we use them within the course. It will be more important to understand their use within regression then knowing the distribution in depth. Basically, when we implement specific hypothesis tests, we just need to know which distribution is most appropriate for the test.
3. Is the F distribution used for things outside of ANOVA?
Yes! In regression, we often use the F-distribution through the F-test (same as ANOVA) However, in regression, we are comparing the variance of two models, that may differ by a coefficient. See the STAT 501 page for more info if interested. In ANOVA, we are comparing variance between and within groups. Both use the same test, but with different goals!
4. Multivariable vs multivariate?
Some people misuse “multivariate” instead of “multivariable” modeling. In this class, we will only look at multivariable regression. Here’s the big difference:
- Multivariable: model with multiple independent variables (covariates, predictors)
- If we want to see how our outcome (height) is related to parent height, birth country, sex assigned at birth, etc.
- Multivariate: model with multiple dependent variables (outcome)
- If we want to extend the outcome from height to height and head circumference. Multivariate modeling would try to model both outcomes together and see how they are related to other variables.