HW 2 and Lab 2
2025-02-12
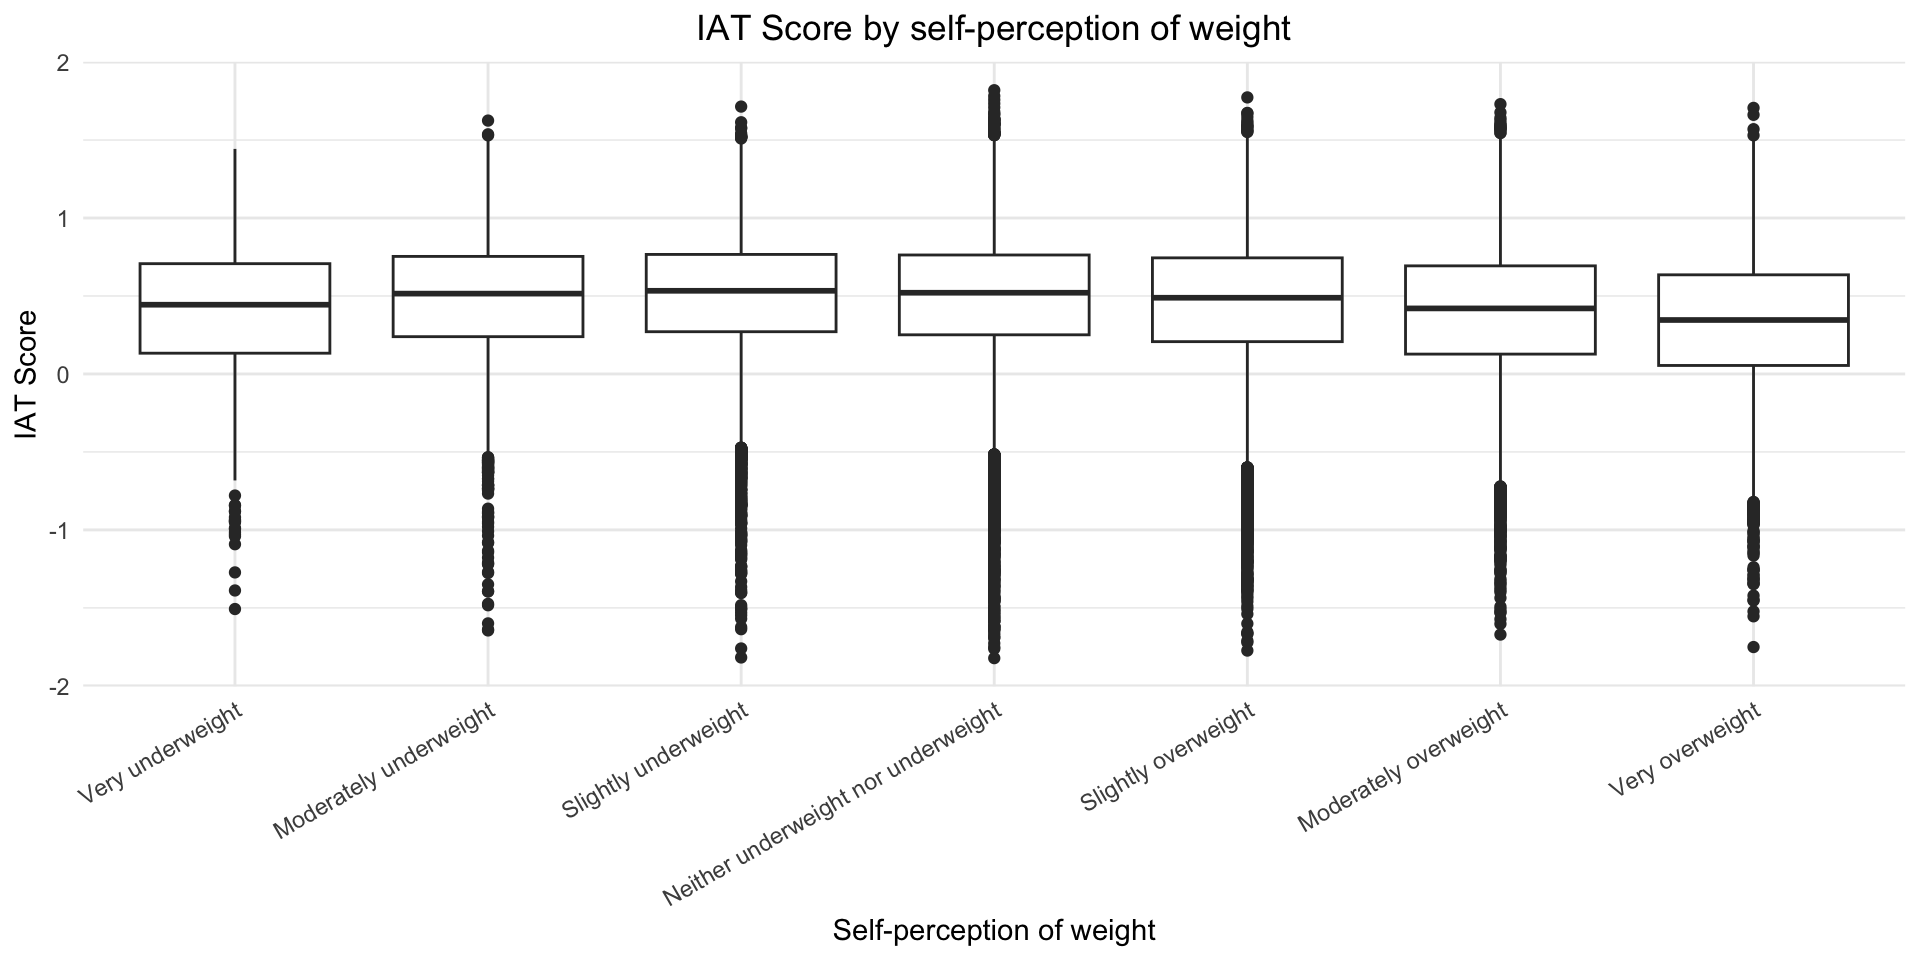
4.3 Bivariate exploratory data analysis
- You only needed to create one plot!!
- My research question: Is self-perception of weight associated with IAT score?
How I made the plot
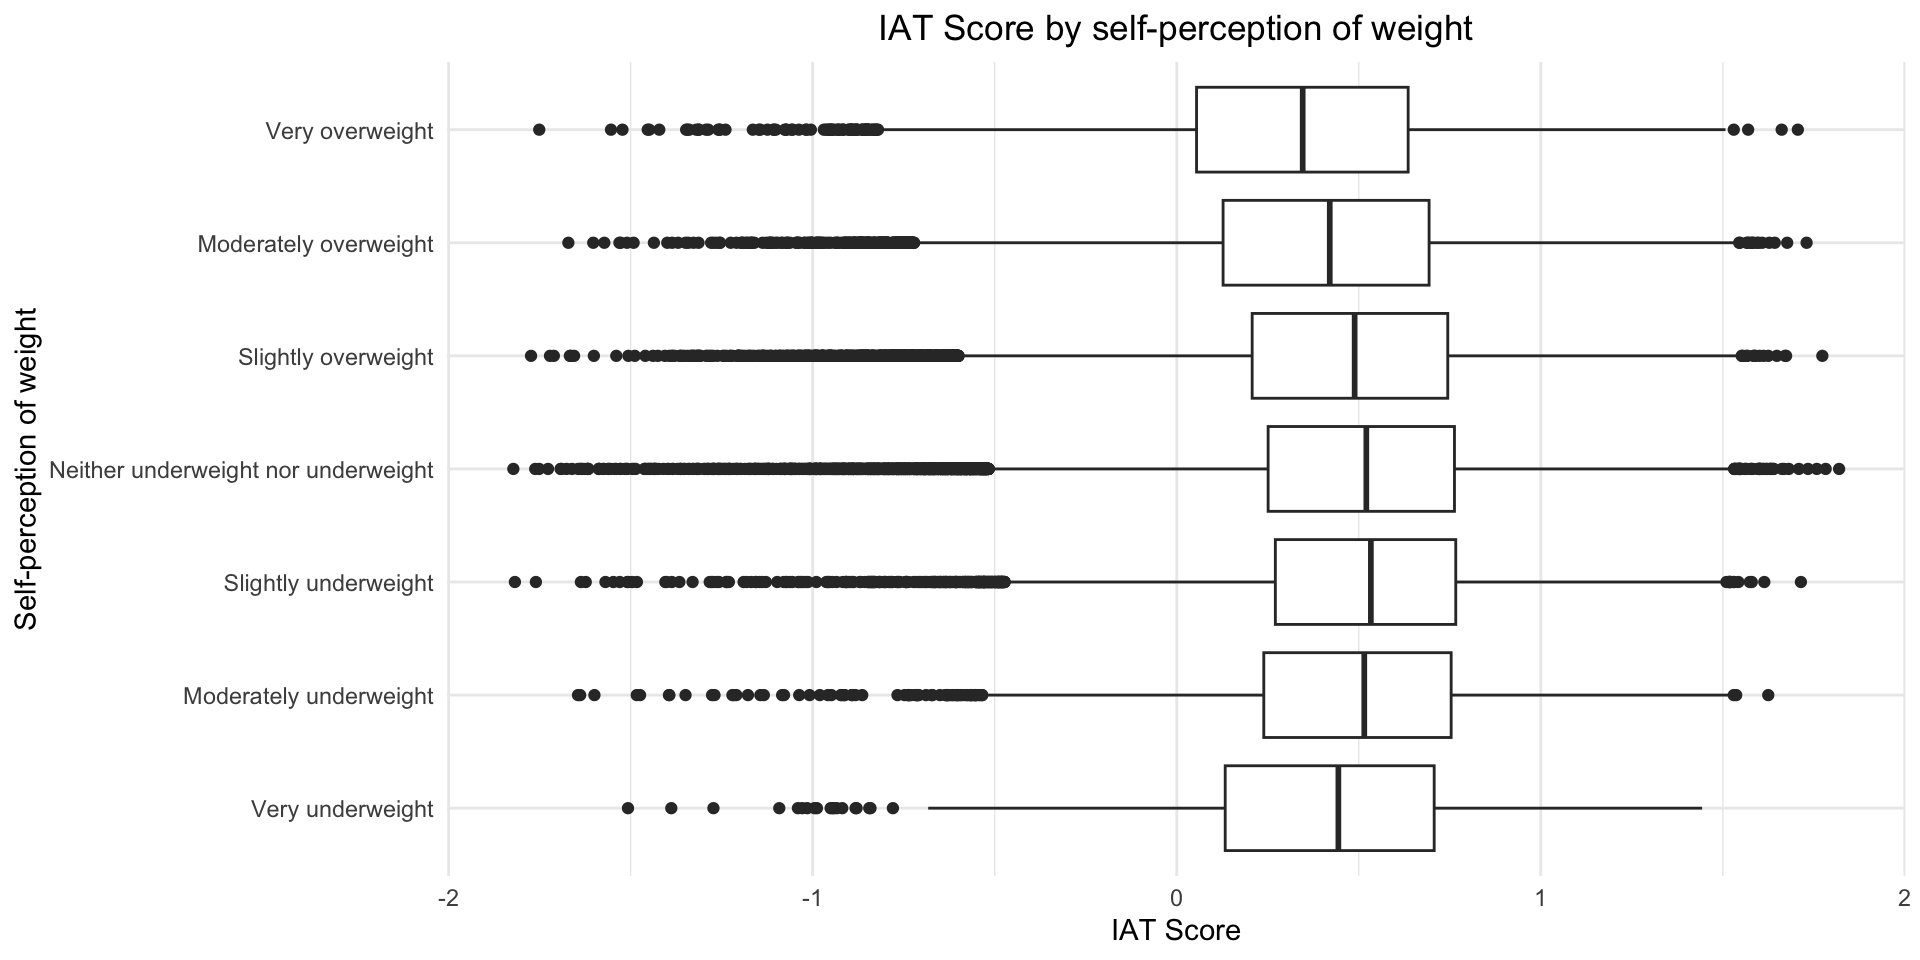
4.3 Bivariate exploratory data analysis
- You only needed to create one plot!!
- My research question: Is self-perception of weight associated with IAT score?
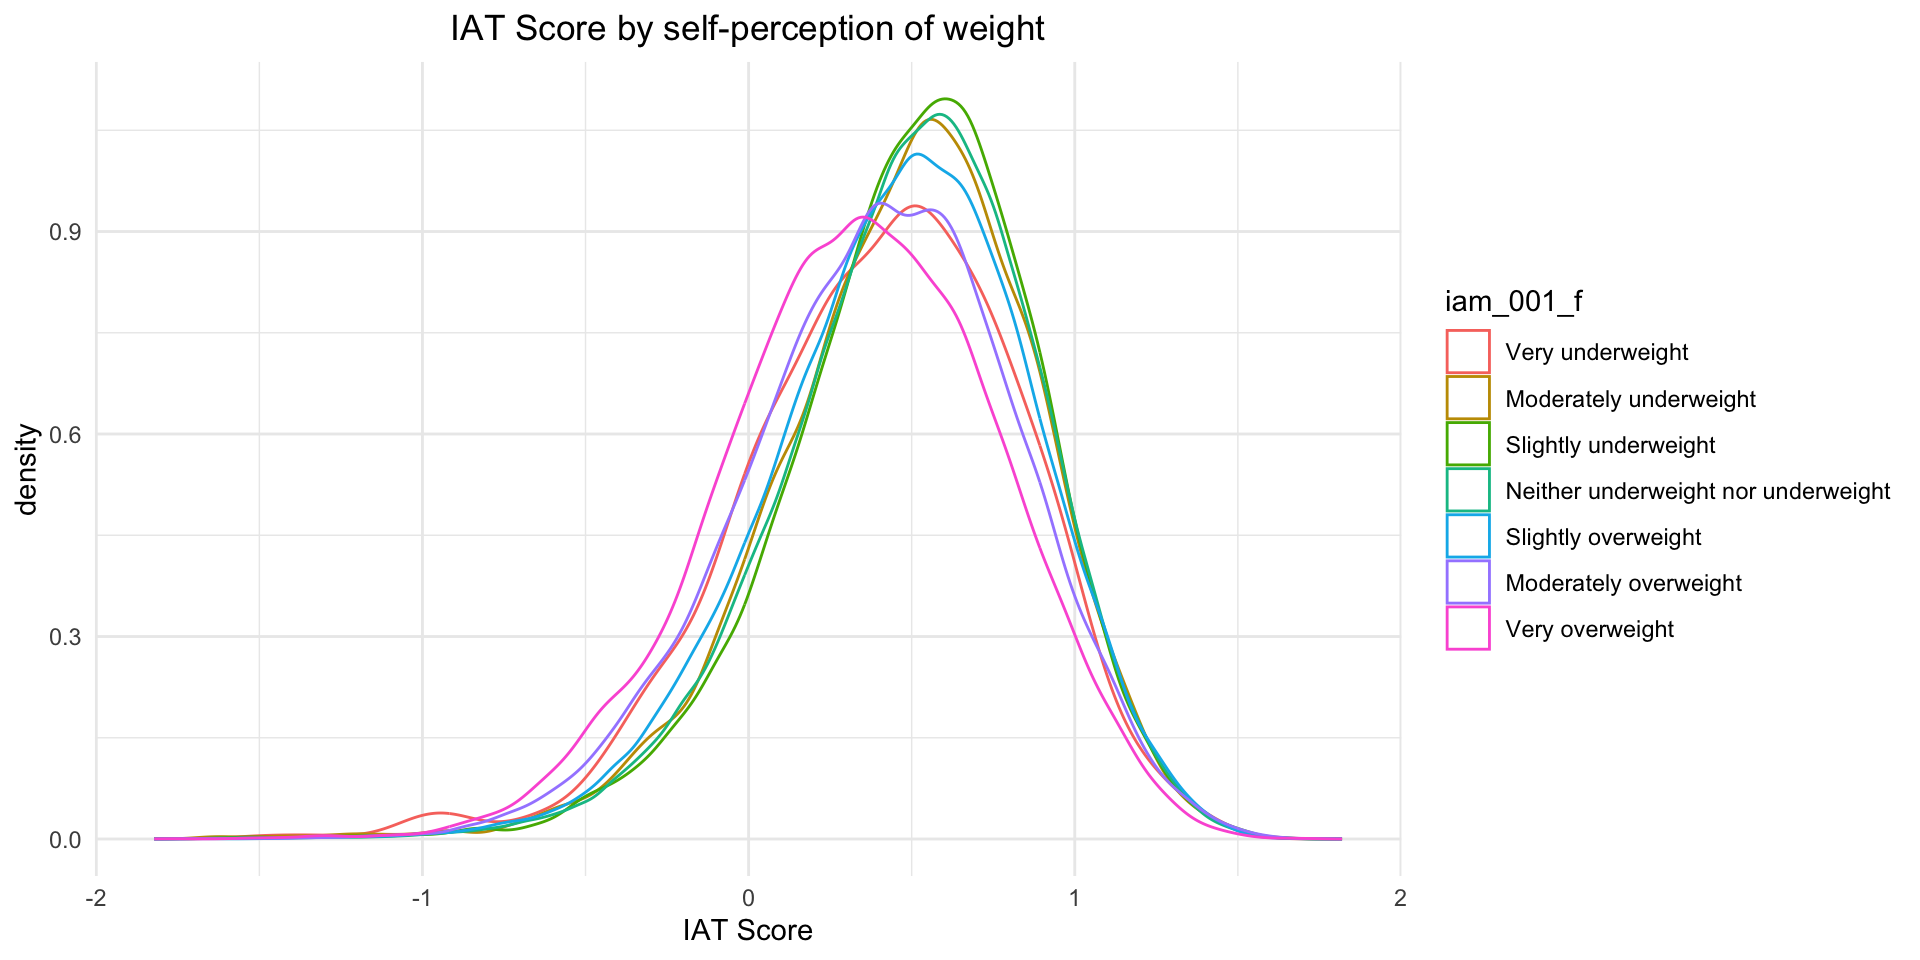
4.3 Bivariate exploratory data analysis
- You only needed to create one plot!!
- My research question: Is self-perception of weight associated with IAT score?
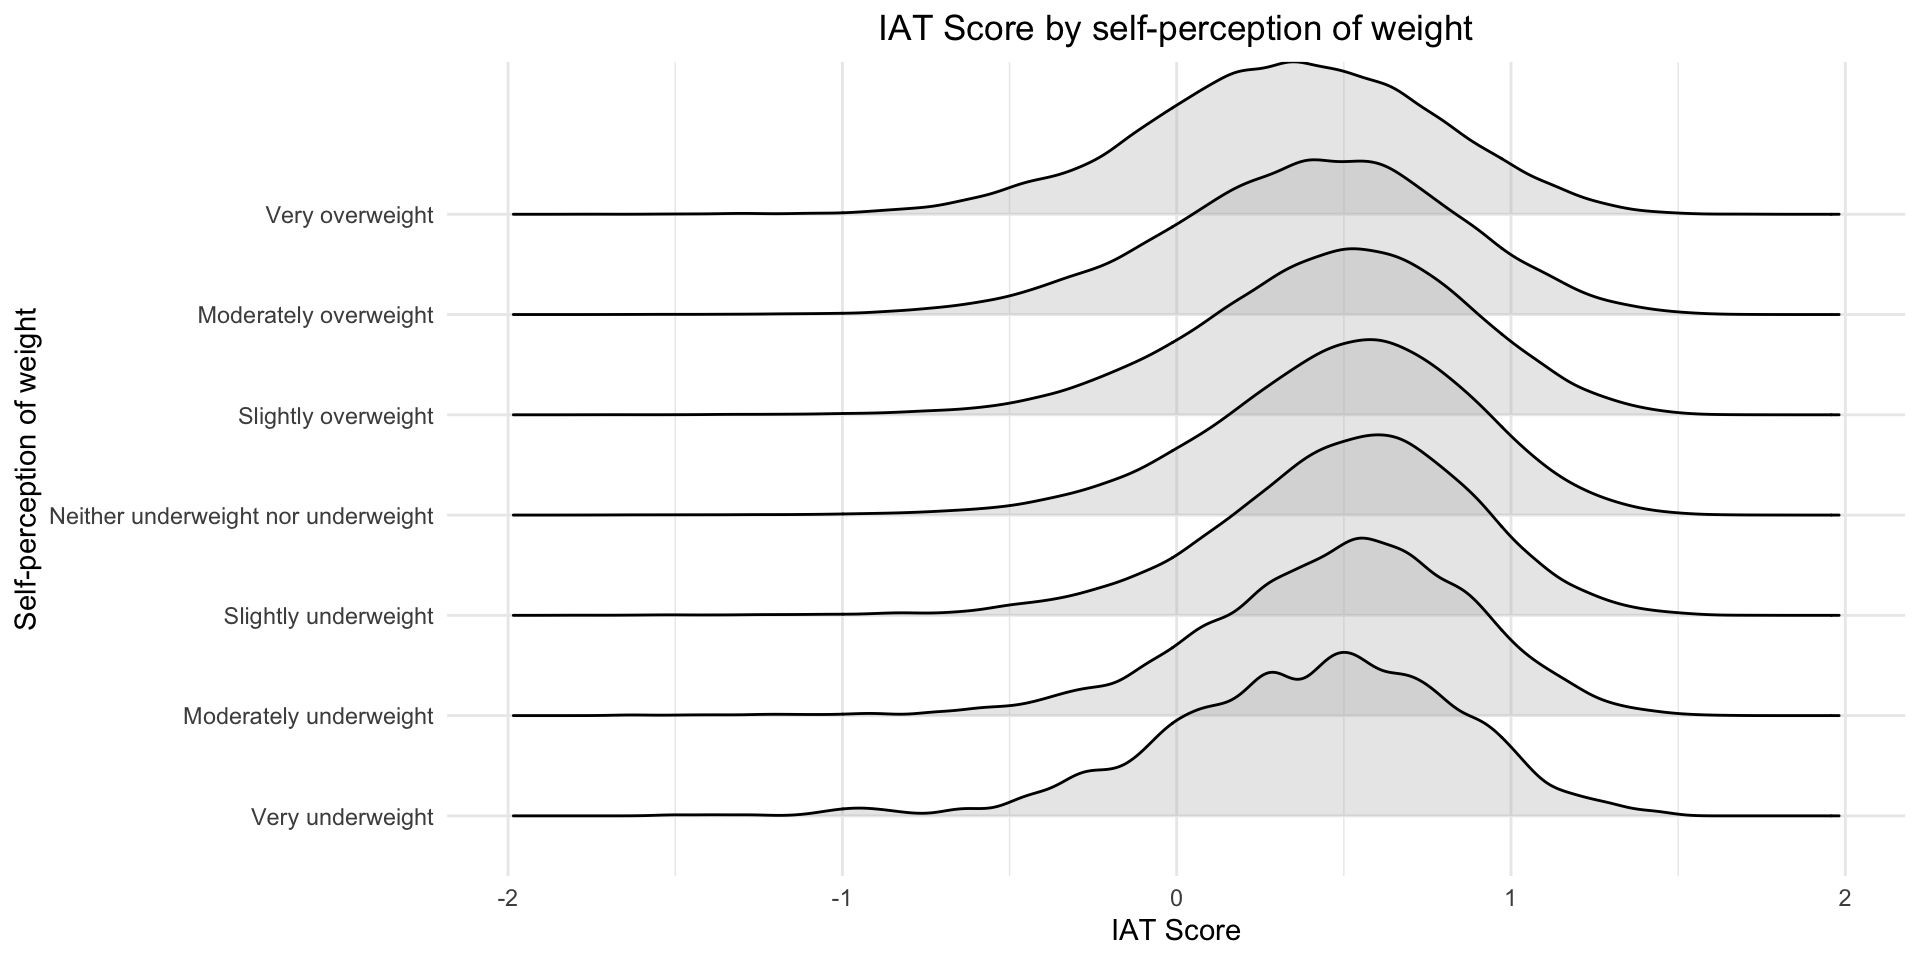
4.3 Bivariate exploratory data analysis
- You only needed to create one plot!!
- My research question: Is self-perception of weight associated with IAT score?
How I made the plot
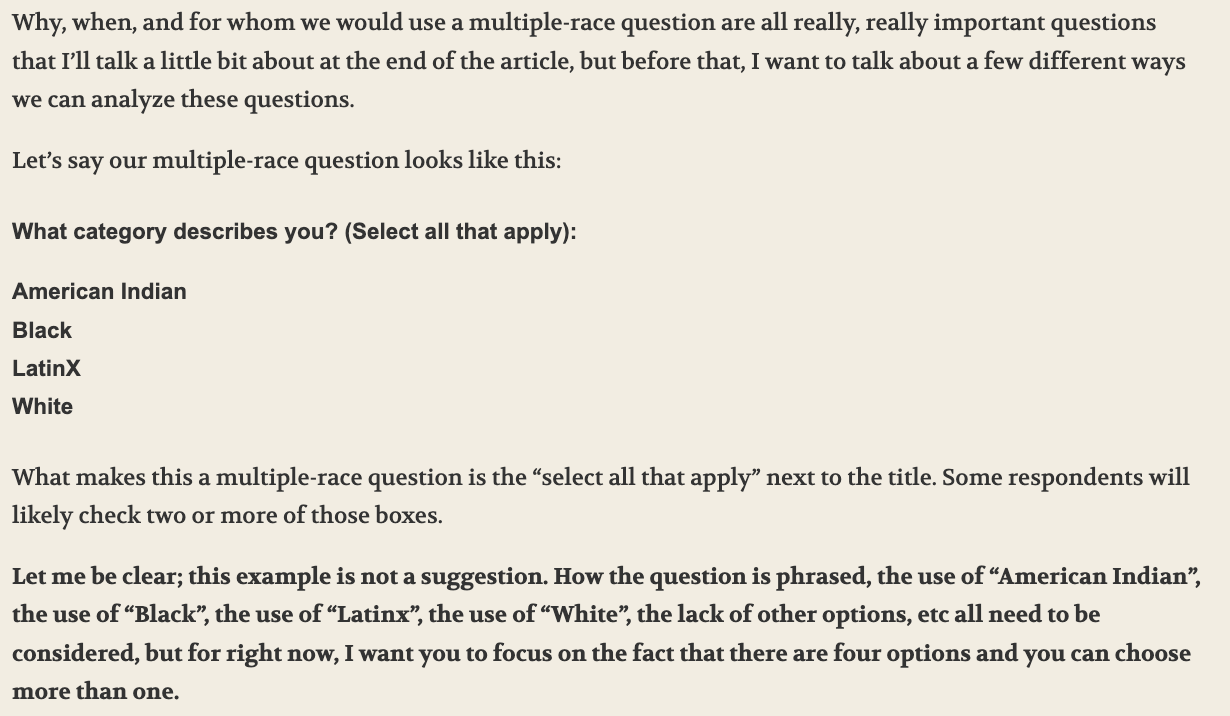
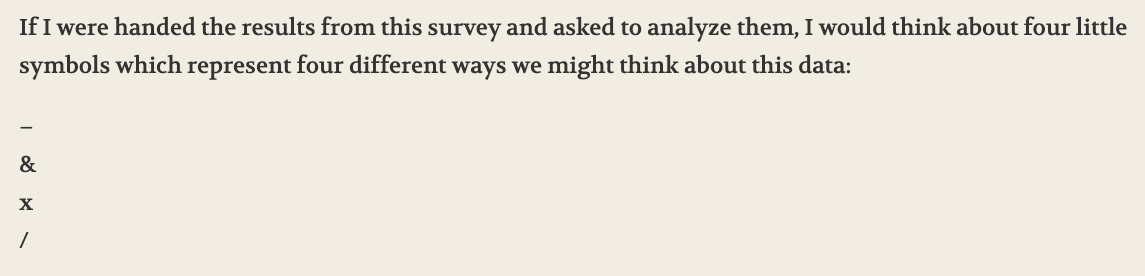
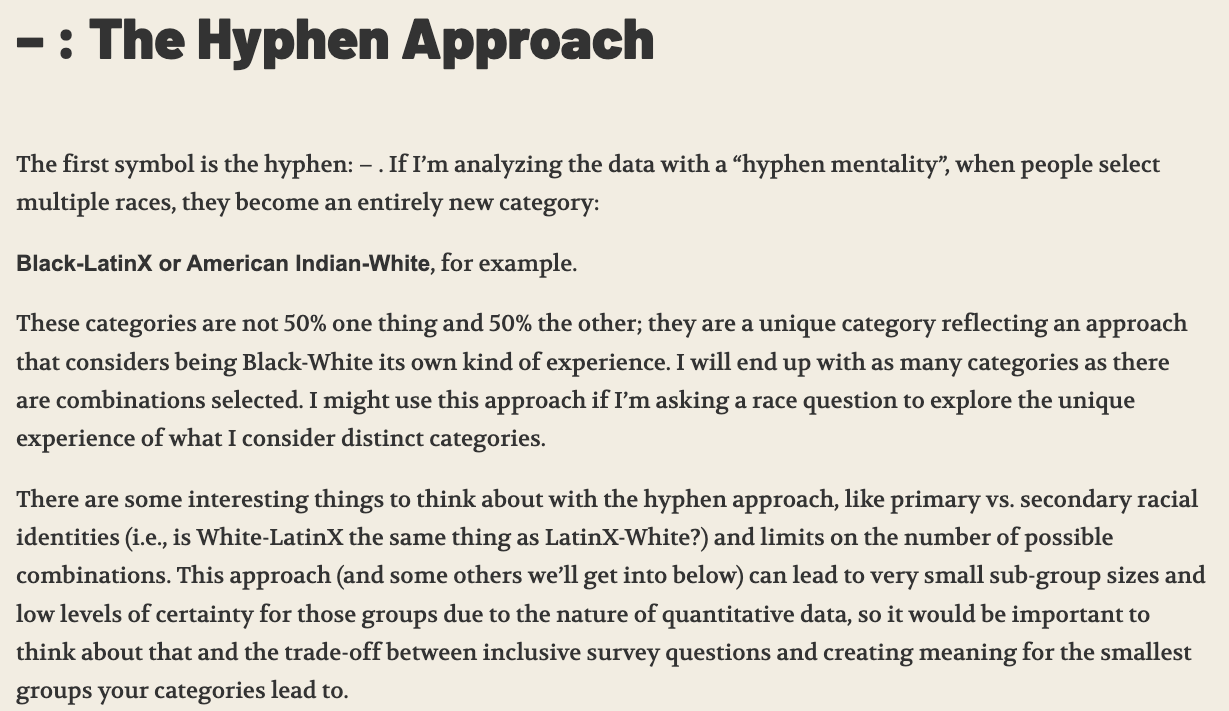
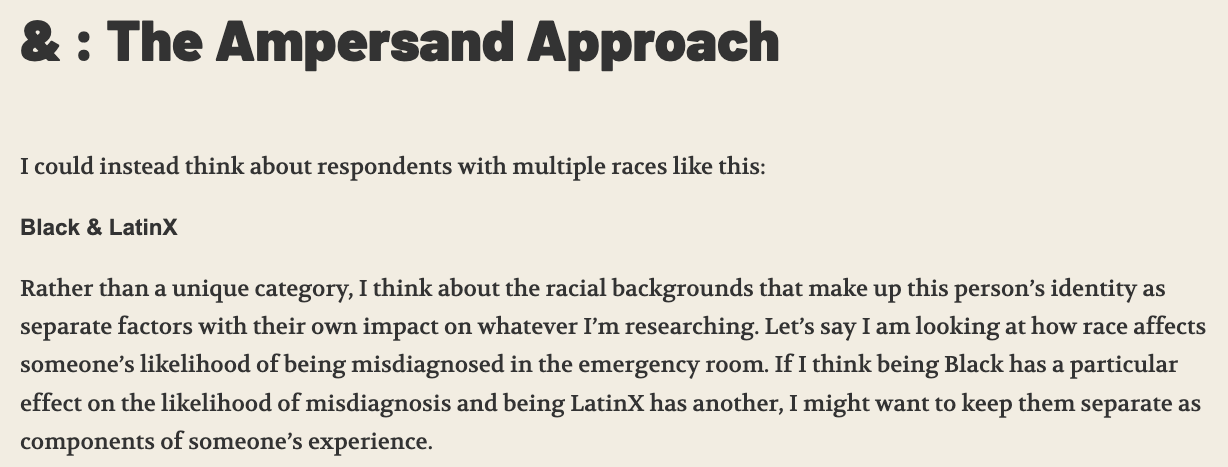
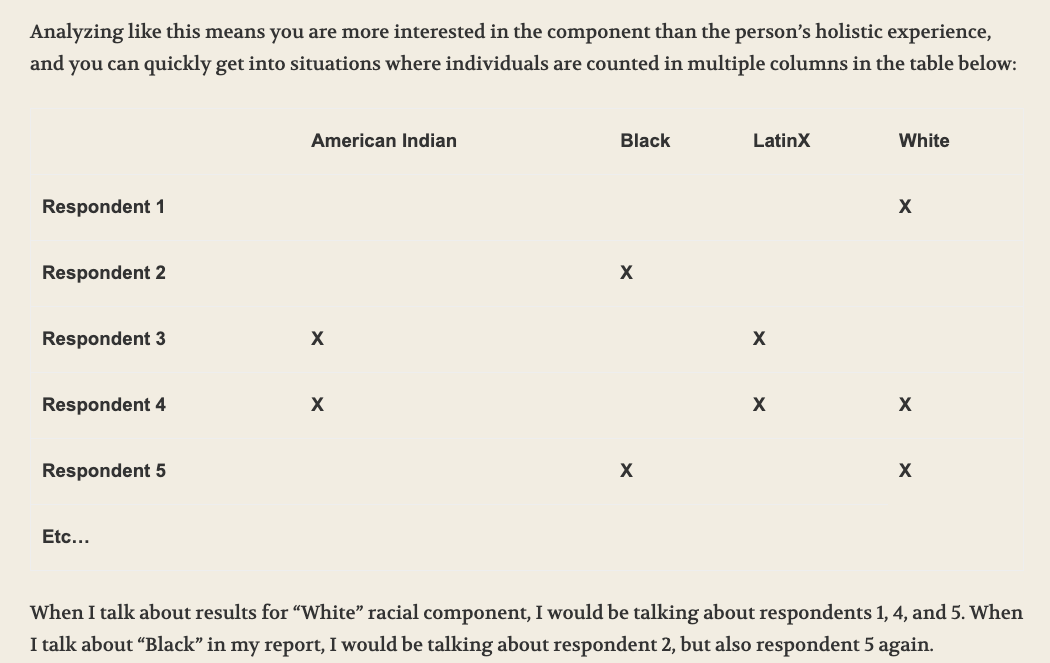
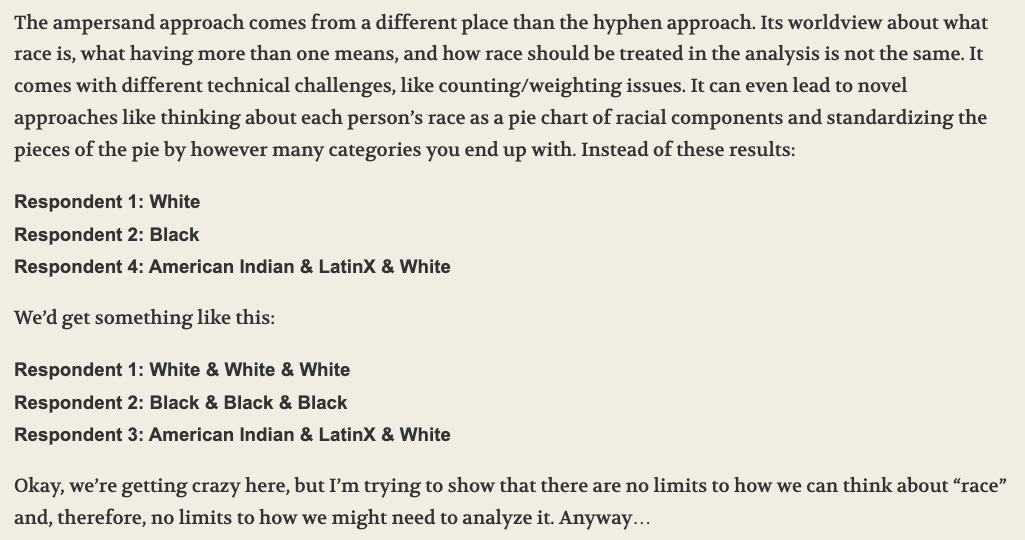
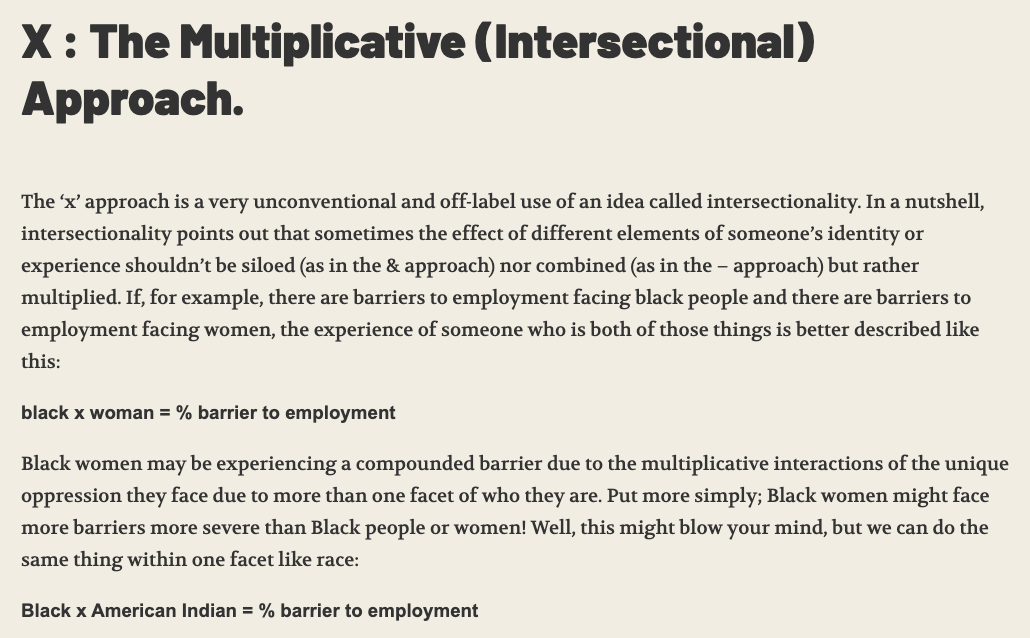
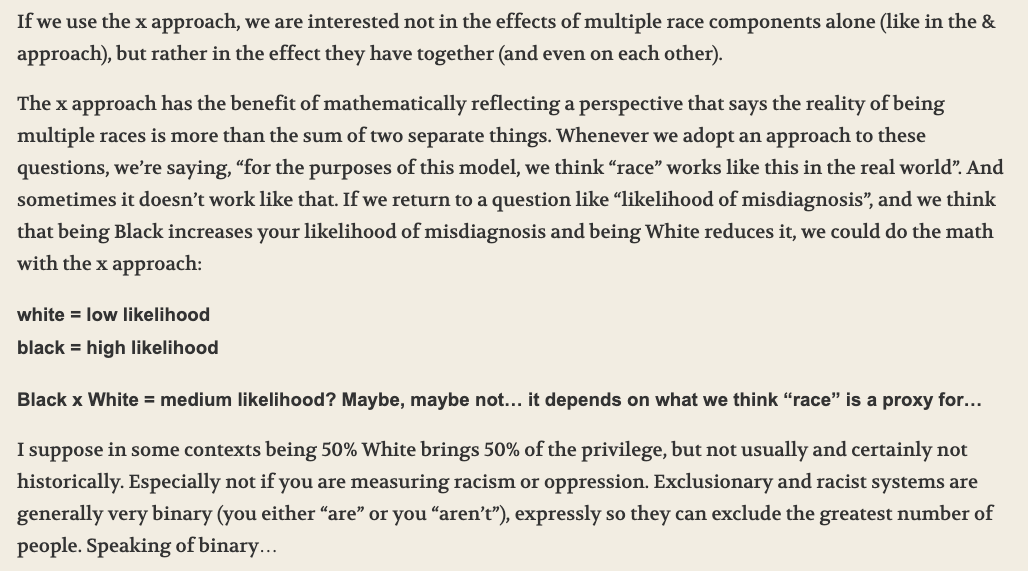
4 Approaches to Multiple-Race Questions from We All Count
- This method works for any multi-level variable