graph TD

    %% Define Node Styles
    classDef discrete fill:#D6EAF8,stroke:#5DADE2,color:#333
    classDef continuous fill:#D5F5E3,stroke:#58D68D,color:#333

    %% === NODES ===

    %% Discrete Distributions
    Bern(Bernoulli)
    Geo(Geometric)
    Bin(Binomial)
    NegBin(Negative Binomial)
    Hyper(Hypergeometric)
    Pois(Poisson)

    %% Continuous Distributions
    Exp(Exponential)
    Gam(Gamma)
    Norm(Normal)
    Chi(Chi-Squared)

    %% === CONNECTIONS ===
    Bern -- "1" --> Geo
    Bern -- "2" --> Bin
    Pois -- "3" --> Bin
    Bin -- "9" --> Hyper
    Norm -- "4" --> Bin
    Norm -- "5" --> Chi

    Geo -- "8" --> NegBin
    Pois -- "7" --> Exp
    Gam -- "6" --> Exp


    %% Apply Styles
    class Bern,Bin,Geo,NegBin,Hyper,DiscUnif,Pois discrete
    class ContUnif,Exp,Gam,Norm,Chi continuous
Homework 6
BSTA 550
Due:
r library(here); source(here('class_dates.R')); hw6 %>% format('%m/%d') at 11pm
Directions
Please turn in this homework on Sakai. Please submit your homework in pdf or html format.
You can type your work on your computer or submit a photo of your written work or any other method that can be turned into a pdf. The Adobe Scan phone app is an easy way to scan photos and compile into a PDF. Please let me know if you greatly prefer to submit a physical copy. We can work out another way for you to turn in homework.
You must show all of your work to receive credit.
Extra problems do not need to be turned in!
Questions
From last homework: The following table shows the results of a survey in which the subjects were a sample of 300 adults residing in a certain metropolitan area. Each subject was asked to indicate which of three policies they favored with respect to smoking in public places. (Table is from Biostatistics: A Foundation for Analysis in the Health Sciences, 10th Edition, Daniel, Wayne W.; Cross, Chad L., pg. 630)
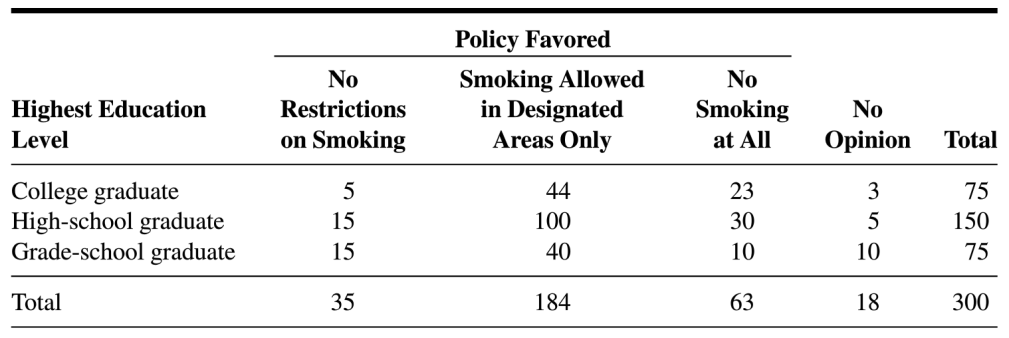
Let \(X=\) highest education level and \(Y=\) policy favored. We can let \(X=1\) for college graduate, \(X=2\) for high-school graduate, etc., and similarly for \(Y\), or just keep the category names for the different levels of \(X\) and \(Y\)
Make a table for the conditional pmf \(p_{X|Y}(x|y)\) and briefly describe in words what the values are the probability of.
Make a table for the conditional pmf \(p_{Y|X}(y|x)\) and briefly describe in words what the values are the probability of.
Each day, Maude has a 1% chance of losing her cell phone (her behavior on different days is independent). Each day, Maude has a 3% chance of forgetting to eat breakfast (again, her behavior on different days is independent). Her breakfast and cell phone habits are independent. Let \(X\) be the number of days until she first loses her cell phone. Let \(Y\) be the number of days until she first forgets to eat breakfast. (Here, \(X\) and \(Y\) are independent.)
Find the joint probability mass function of \(X\) and \(Y\).
Find the joint cdf of \(X\) and \(Y\) and briefly explain what \(F_{X,Y}(x,y)\) represents in the context of the problem. (Hint: \(\sum_{n=1}^{N} r^{n-1} = \frac{1-r^N}{1-r}\) for \(r \neq 1\).)
Find the conditional pmf \(p_{Y|X}(y|x)\).
Consider a pair of random variables \(X\), \(Y\) with constant joint density on the quadrilateral with vertices \((0,0)\), \((2,0)\), \((2,6)\), \((0,12)\).
- For \(0 \leq y \leq 6\), find the conditional density \(f_{X|Y}(x,y)\) of \(X\), given \(Y=y\).
- For \(6 \leq y \leq 12\), find the conditional density \(f_{X|Y}(x,y)\) of \(X\), given \(Y=y\).
- Find the conditional probability that \(X \leq 1\), given \(3 \leq Y \leq 9\).
- Find \(P(0.5 \leq X \leq 3 | Y=4)\)
- Find \(P(0.5 \leq X \leq 3 | Y=7)\)
Consider the joint density of \(X\) and \(Y\): \[f_{X,Y}(x,y)= \dfrac32 x y\] for \(0 \leq x\) and \(0 \leq y\) and \(x+y \leq 2\) and \(f_{X,Y}(x,y)=0\) otherwise. Find \(E(Y)\).
I would like us to create a reference table for the important distributions. Fill out the following table and save it for future reference.
| RV / Distribution | Type | Parameters | Possible values \(X\) | PMF / PDF | Mean \(E[X]\) | Variance \(Var(X)\) |
|---|---|---|---|---|---|---|
| Bernoulli | Discrete | \(p\) | \(X = \{0, 1\}\) | \(p^x(1-p)^{1-x}\) | \(p\) | \(p(1-p)\) |
| Binomial | ||||||
| Geometric | ||||||
| Negative Binomial | ||||||
| Hypergeometric | ||||||
| Poisson | ||||||
| Discrete Uniform | ||||||
| Continuous Uniform | ||||||
| Exponential | ||||||
| Gamma | ||||||
| Normal |
- It is also important to know how different RVs/distributions relate to one another. In the following web, please fill in the relationships between each distribution. You can recreate the web or you can write out the relationships in a numbered list.