- 1
- Set the seed once, so we get the same “random” rolls every time the slides are made.
- 2
- Save the number of simulations and the number of dice as named values, so they are easy to change later.
- 3
-
Same setup as Lesson 2: one row for every combination of simulation and die. The pipe
|>passes the table to the next line. - 4
-
mutate()adds a column calledroll.n()is the number of rows, so every row gets one random roll from 1 to 4.
Lesson 3: Language of Probability
Nicky Wakim
2026-10-05
Learning Objectives
Use set notation, Venn diagrams, and the concepts of unions, intersections, complements, and mutually exclusive events to represent and describe events.
Apply the axioms of probability and related properties to calculate probabilities and prove simple results.
Explain and use De Morgan’s Laws to simplify and solve probability problems.
Connect partitions and all rules of probability to calculate probabilities.
Where are we?
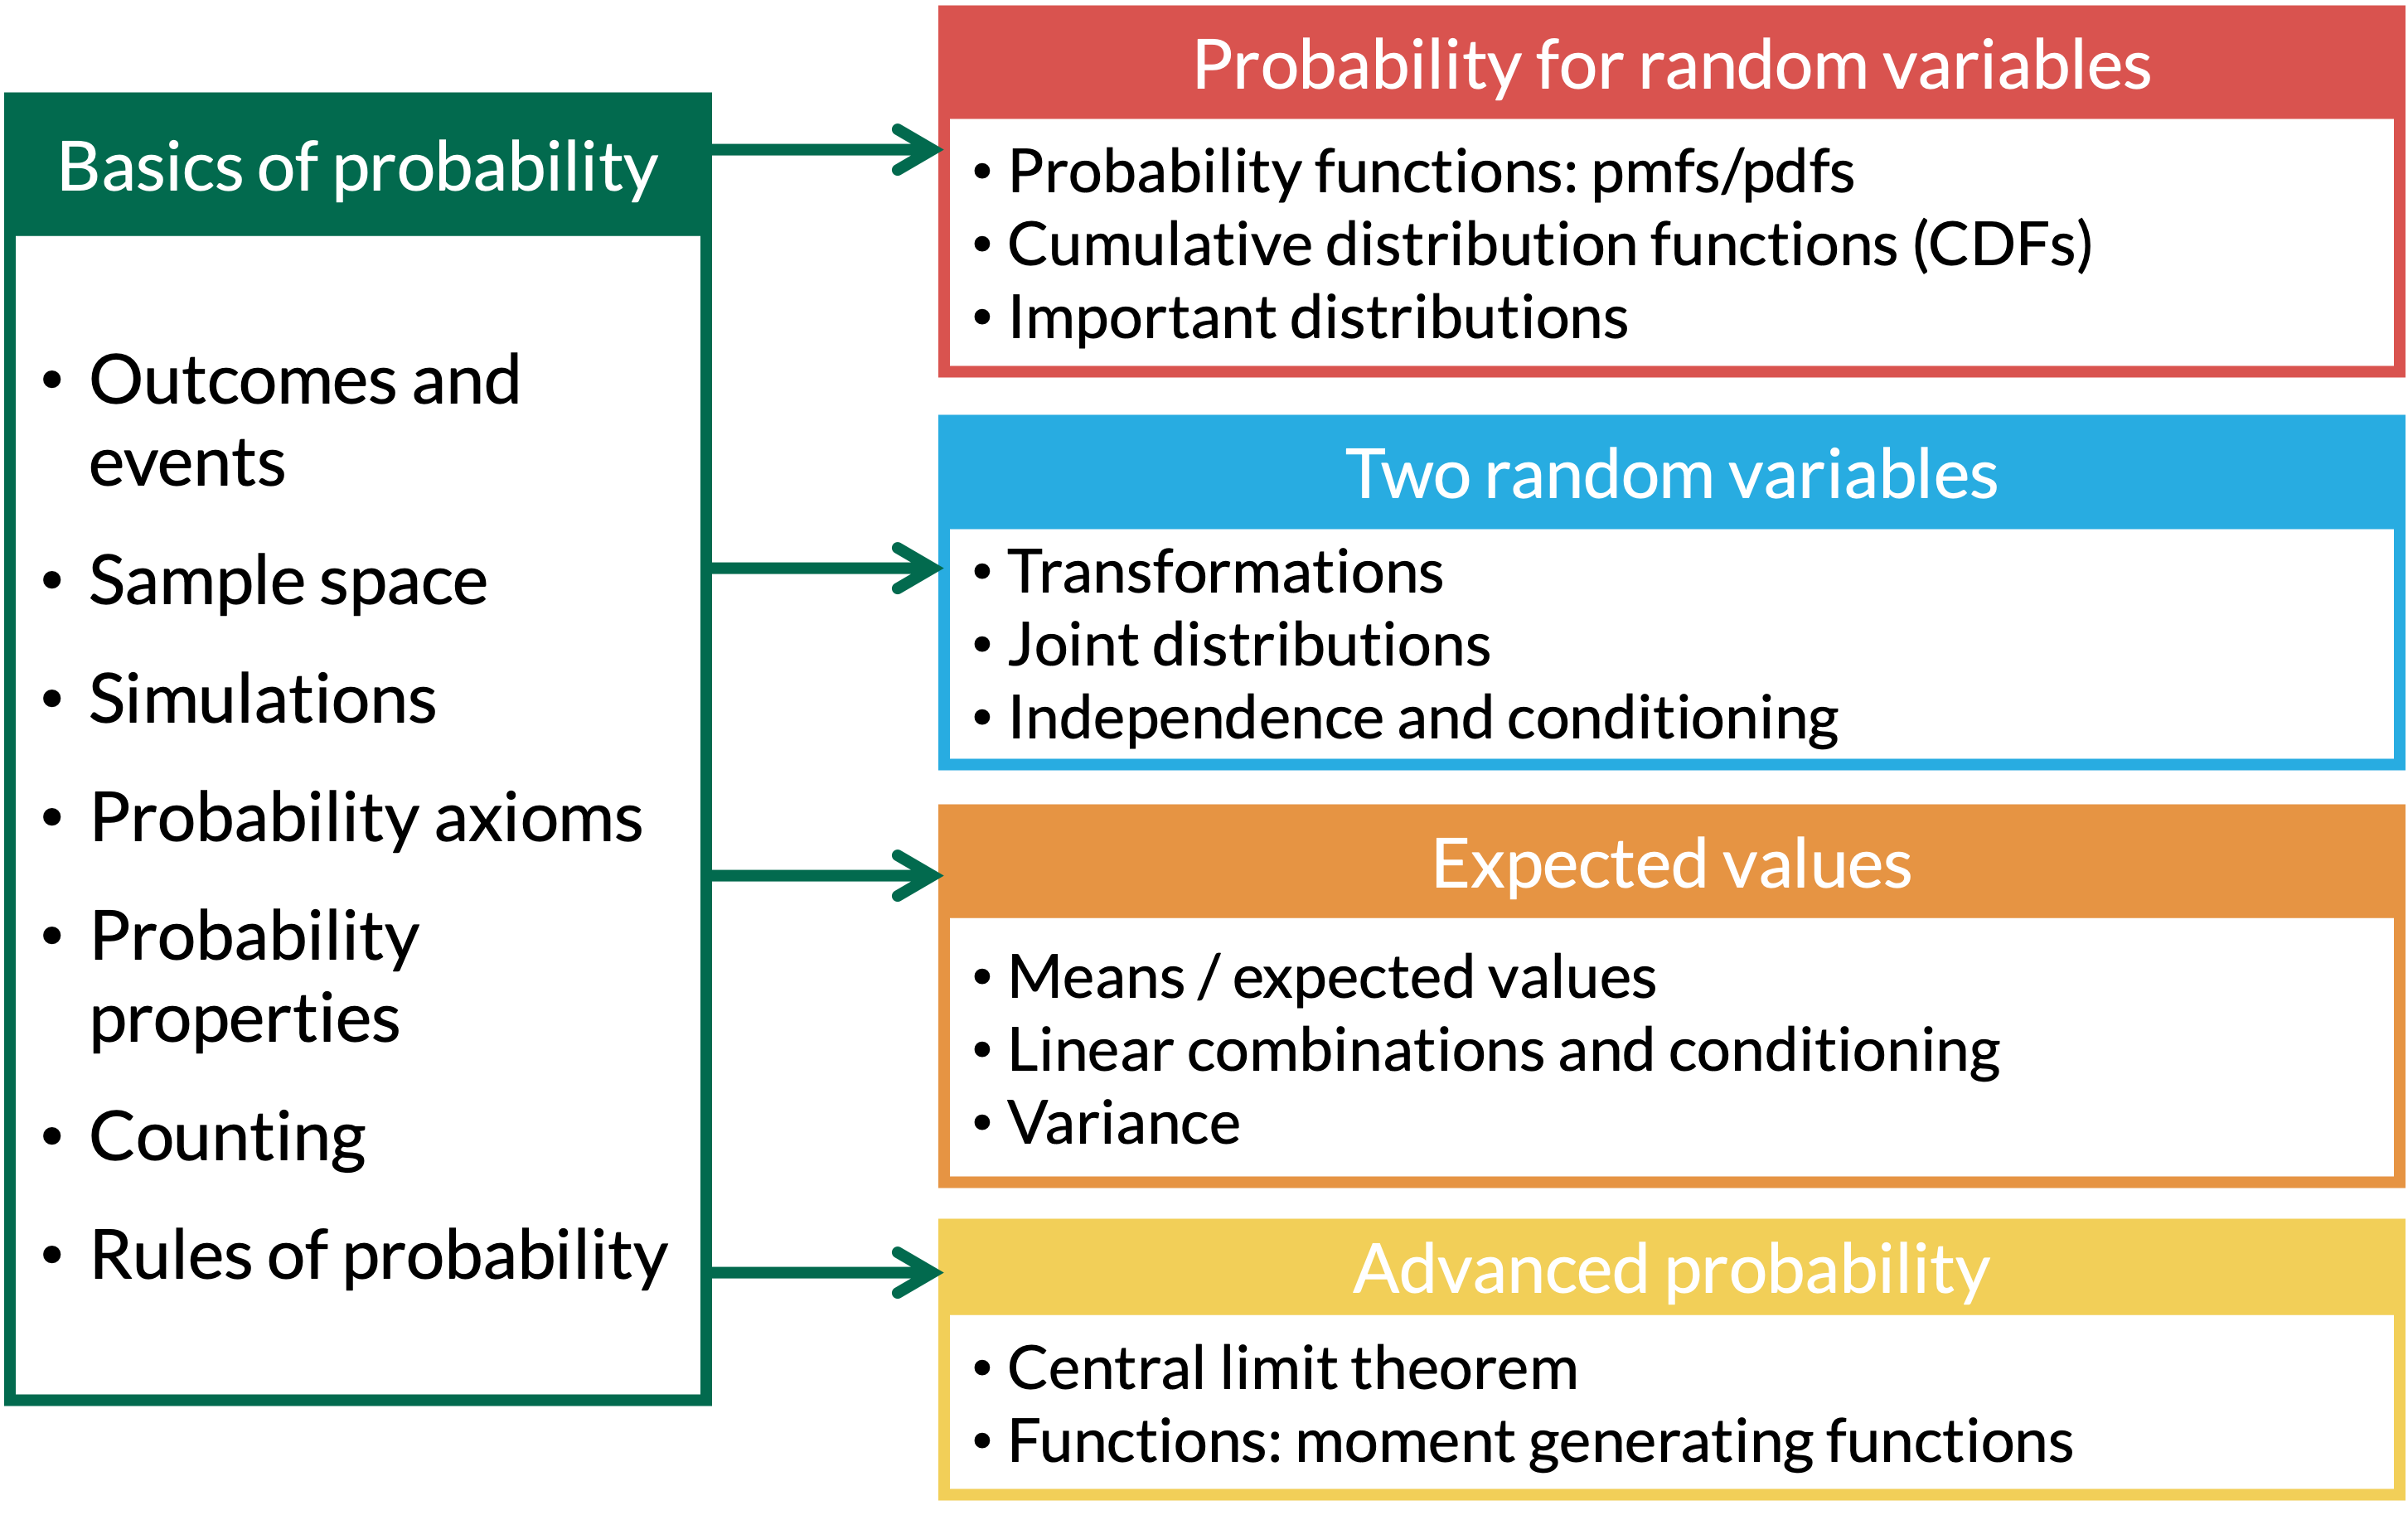
Learning Objectives
- Use set notation, Venn diagrams, and the concepts of unions, intersections, complements, and mutually exclusive events to represent and describe events.
Apply the axioms of probability and related properties to calculate probabilities and prove simple results.
Explain and use De Morgan’s Laws to simplify and solve probability problems.
Connect partitions and all rules of probability to calculate probabilities.
Set Theory (1/2)
Definition: Union
The union of events \(A\) and \(B\), denoted by \(A \cup B\), contains all outcomes that are in \(A\) or \(B\) or both
Definition: Intersection
The intersection of events \(A\) and \(B\), denoted by \(A \cap B\), contains all outcomes that are both in \(A\) and \(B\).
Set Theory (2/2)
Definition: Complement
The complement of event \(A\), denoted by \(A^C\) or \(A'\), contains all outcomes in the sample space \(S\) that are not in \(A\) .
Definition: Mutually Exclusive
Events \(A\) and \(B\) are mutually exclusive, or disjoint, if they have no outcomes in common. In this case \(A \cap B = \emptyset\), where \(\emptyset\) is the empty set.
How can we code some of these? (1/4)
Example 1: Simulating Two Rolls of a Fair Four-Sided Die
We’re going to roll two four-sided dice. This time, let’s say event A is rolling matching numbers, event B is rolling at least one 2, and event C is the sum of the dice is 5
- First, we simulate rolling two four-sided dice. We start small, with only 5 simulations, so we can see every roll
How can we code some of these? (2/4)
Example 1: Simulating Two Rolls of a Fair Four-Sided Die
We’re going to roll two four-sided dice. This time, let’s say event A is rolling matching numbers, event B is rolling at least one 2, and event C is the sum of the dice is 5
- Now, we make one row per simulation, with a
TRUE/FALSEcolumn for each event
- 1
-
Start with
rollsand save the result asevent_sims. - 2
- Group the rows by simulation, so the next line works on the two dice of each simulation together.
- 3
-
n_distinct()counts the different values. The dice match exactly when there is only 1 distinct value, soAisTRUEfor matching rolls. - 4
-
roll == 2checks each die.any()isTRUEif at least one of them is a 2. - 5
-
sum()adds the two dice, and== 5checks if the total is 5.
How can we code some of these? (3/4)
Union
Intersection
How can we code some of these? (4/4)
Example 1: Simulating Two Rolls of a Fair Four-Sided Die
We’re going to roll two four-sided dice. This time, let’s say event A is rolling matching numbers, event B is rolling at least one 2, and event C is the sum of the dice is 5
- Same code, now with 10,000 simulations
- 1
- The only change: 10,000 simulations instead of 5.
- 2
- The rest is the same code as before.
- Estimate the probabilities
- 1
-
mean()of aTRUE/FALSEcolumn is a proportion:TRUEcounts as 1 andFALSEas 0. Somean(A)is the proportion of simulations where A happened. - 2
-
We can use
&and|right insidemean().
# A tibble: 1 × 4
    p_A   p_B p_A_and_B p_A_or_B
  <dbl> <dbl>     <dbl>    <dbl>
1 0.255 0.437    0.0676    0.624
Exact: \(\frac{4}{16} = 0.25\), \(\frac{7}{16} = 0.4375\), \(\frac{1}{16} = 0.0625\), \(\frac{10}{16} = 0.625\)
Learning Objectives
- Use set notation, Venn diagrams, and the concepts of unions, intersections, complements, and mutually exclusive events to represent and describe events.
- Apply the axioms of probability and related properties to calculate probabilities and prove simple results.
Explain and use De Morgan’s Laws to simplify and solve probability problems.
Connect partitions and all rules of probability to calculate probabilities.
Probability Axioms
Axiom 1
For every event \(A\), \(0\leq\mathbb{P}(A)\leq 1\). Probability is between 0 and 1.
Axiom 2
For the sample space \(S\), \(\mathbb{P}(S)=1\).
Axiom 3
If \(A_1, A_2, A_3, \ldots\), is a collection of disjoint events, then \[\mathbb{P}\Big( \bigcup \limits_{i=1}^{\infty}A_i\Big) = \sum_{i=1}^{\infty}\mathbb{P}(A_i).\] The probability of at least one \(A_i\) is the sum of the individual probabilities of each.
Some probability properties
Using the Axioms, we can prove all other probability properties! Events A, B, and C are not necessarily disjoint!
Proposition 1
For any event \(A\), \(\mathbb{P}(A)= 1 - \mathbb{P}(A^C)\)
Proposition 2
\(\mathbb{P}(\emptyset)=0\)
Proposition 3
If \(A \subseteq B\), then \(\mathbb{P}(A) \leq \mathbb{P}(B)\)
Proposition 4
\[\mathbb{P}(A \cup B) = \mathbb{P}(A) + \mathbb{P}(B) - \mathbb{P}(A \cap B)\] where \(A\) and \(B\) are not necessarily disjoint
Proposition 5
\(\begin{aligned} \mathbb{P}(A \cup B & \cup C) = \mathbb{P}(A) + \mathbb{P}(B) + \\ & \mathbb{P}(C) - \mathbb{P}(A \cap B) - \mathbb{P}(A \cap C) - \\ & \mathbb{P}(B \cap C) + \mathbb{P}(A \cap B \cap C) \end{aligned}\)
Proposition 1 Proof
Proposition 1
For any event \(A\), \(\mathbb{P}(A)= 1 - \mathbb{P}(A^C)\)
Use Axioms!
A1: \(0\leq\mathbb{P}(A)\leq 1\)
A2: \(\mathbb{P}(S)=1\)
A3: For disjoint \(A_i\),
\(\mathbb{P}\Big( \bigcup \limits_{i=1}^{\infty}A_i\Big) = \sum_{i=1}^{\infty}\mathbb{P}(A_i)\)
Proposition 1 in our dice simulation
Proposition 1
For any event \(A\), \(\mathbb{P}(A)= 1 - \mathbb{P}(A^C)\)
Two dice: B is “at least one 2”, so \(B^C\) is “no 2s”
- 1
- Back to our 10,000 simulations of two dice.
- 2
-
!Bis the complement, \(B^C\). - 3
- Proposition 1 says one minus its probability gives \(\mathbb{P}(B)\).
# A tibble: 1 × 3
    p_B p_B_comp p_B_prop_1
  <dbl>    <dbl>      <dbl>
1 0.437    0.563      0.437
Exact: \(1 - \mathbb{P}(B^C) = 1 - \left(\frac{3}{4}\right)^2 = \frac{7}{16} = 0.4375\)
Proposition 2 Proof
Proposition 2
\(\mathbb{P}(\emptyset)=0\)
Use Axioms!
A1: \(0\leq\mathbb{P}(A)\leq 1\)
A2: \(\mathbb{P}(S)=1\)
A3: For disjoint \(A_i\),
\(\mathbb{P}\Big( \bigcup \limits_{i=1}^{\infty}A_i\Big) = \sum_{i=1}^{\infty}\mathbb{P}(A_i)\)
Proposition 3 Proof
Proposition 3
If \(A \subseteq B\), then \(\mathbb{P}(A) \leq \mathbb{P}(B)\)
Use Axioms!
A1: \(0\leq\mathbb{P}(A)\leq 1\)
A2: \(\mathbb{P}(S)=1\)
A3: For disjoint \(A_i\),
\(\mathbb{P}\Big( \bigcup \limits_{i=1}^{\infty}A_i\Big) = \sum_{i=1}^{\infty}\mathbb{P}(A_i)\)
Proposition 4 Visual Proof
Proposition 4
\(\mathbb{P}(A \cup B) = \mathbb{P}(A) + \mathbb{P}(B) - \mathbb{P}(A \cap B)\)
Proposition 4 in our dice simulation
Proposition 4
\(\mathbb{P}(A \cup B) = \mathbb{P}(A) + \mathbb{P}(B) - \mathbb{P}(A \cap B)\)
- A is matching numbers and B is at least one 2, so they overlap at (2, 2)
- 1
- Back to our 10,000 simulations of two dice.
- 2
- The left side of Proposition 4: the proportion of simulations where A or B happened.
- 3
- The right side: add the two proportions, then subtract the overlap once.
# A tibble: 1 × 2
  p_A_or_B add_subtract
     <dbl>        <dbl>
1    0.624        0.624
Exact: \(\frac{4}{16} + \frac{7}{16} - \frac{1}{16} = \frac{10}{16} = 0.625\)
The two columns match exactly, not just approximately
Proposition 5 Visual Proof
Proposition 5
\(\mathbb{P}(A \cup B \cup C) = \mathbb{P}(A) + \mathbb{P}(B) + \mathbb{P}(C) - \mathbb{P}(A \cap B) - \mathbb{P}(A \cap C) - \mathbb{P}(B \cap C) + \mathbb{P}(A \cap B \cap C)\)
Some final remarks on these propositions
- Notice how we spliced events into multiple disjoint events
- It is often easier to work with disjoint events
- If we want to calculate the probability for one event, we may need to get creative with how we manipulate other events and the sample space
- Helps us use any incomplete information we have
Learning Objectives
Use set notation, Venn diagrams, and the concepts of unions, intersections, complements, and mutually exclusive events to represent and describe events.
Apply the axioms of probability and related properties to calculate probabilities and prove simple results.
- Explain and use De Morgan’s Laws to simplify and solve probability problems.
- Connect partitions and all rules of probability to calculate probabilities.
De Morgan’s Laws
Theorem: De Morgan’s 1st Law
For a collection of events (sets) \(A_1, A_2, A_3, \ldots\)
\[\bigcap\limits_{i=1}^{n}A_i^C = \Big(\bigcup\limits_{i=1}^{n}A_i\Big)^C\]
“all not A = \((\)at least one event A\()^C\)” or “intersection of the complements is the complement of the union”
Theorem: De Morgan’s 2nd Law
For a collection of events (sets) \(A_1, A_2, A_3, \ldots\)
\[\bigcup\limits_{i=1}^{n}A_i^C = \Big(\bigcap\limits_{i=1}^{n}A_i\Big)^C\]
“at least one event not A = \((\)all A\()^C\)” or “union of complements is complement of the intersection”
Example 2: Blood Pressures (BPs)
Suppose you have \(n\) subjects in a study. Let \(H_i\) be the event that person \(i\) has high BP, for \(i=1\ldots n\).
Use set theory notation to denote the following events:
Event subject \(i\) does not have high BP
Event all \(n\) subjects have high BP
Event at least one subject has high BP
Event all of them do not have high BP
Event at least one subject does not have high BP
Example 2: Blood Pressures (BPs)
Suppose you have \(n\) subjects in a study. Let \(H_i\) be the event that person \(i\) has high BP, for \(i=1\ldots n\).
Use set theory notation to denote the following events:
- Event subject \(i\) does not have high BP
- Event all \(n\) subjects have high BP
- Event at least one subject has high BP
Example 2: Blood Pressures (BPs)
Suppose you have \(n\) subjects in a study. Let \(H_i\) be the event that person \(i\) has high BP, for \(i=1\ldots n\).
Use set theory notation to denote the following events:
- Event all of them do not have high BP
- Event at least one subject does not have high BP
De Morgan’s Laws in simulation (1/2)
Simulate \(n = 6\) subjects, each with a 30% chance of high BP, with 10,000 reps
n_subjects <- 6
p_high <- 0.3
subjects <- expand_grid(sim = 1:reps, subject = 1:n_subjects) |>
mutate(status = sample(c("high", "normal"), n(), replace = TRUE,
prob = c(p_high, 1 - p_high)))
bp_sims <- subjects |>
group_by(sim) |>
summarise(all_not_high = all(status != "high"), # Q2
not_any_high = !any(status == "high"), # Q3
any_not_high = any(status != "high"), # Q4
not_all_high = !all(status == "high")) # Q5
head(bp_sims, 3)- 1
- Save the number of subjects and the chance of high BP as named values, so they are easy to change.
- 2
- Same pattern as the dice: one row for every combination of simulation and subject.
- 3
-
Like the unfair coin in Lesson 1:
probgives each label its own chance, here 30% “high” and 70% “normal”. - 4
-
all()isTRUEonly if every subject in the simulation meets the condition. This is \(\bigcap H_i^C\), “all do not have high BP”. - 5
-
!any()is “not (at least one has high BP)”, which is \(\big(\bigcup H_i\big)^C\). De Morgan’s 1st Law says columns 4 and 5 are the same event. - 6
- The same for De Morgan’s 2nd Law: \(\bigcup H_i^C\) (“at least one does not have high BP”) and \(\big(\bigcap H_i\big)^C\) (“not all have high BP”).
# A tibble: 3 × 5
    sim all_not_high not_any_high any_not_high not_all_high
  <int> <lgl>        <lgl>        <lgl>        <lgl>
1     1 FALSE        FALSE        TRUE         TRUE
2     2 FALSE        FALSE        TRUE         TRUE
3     3 FALSE        FALSE        TRUE         TRUE
De Morgan’s Laws in simulation (2/2)
- Check that each pair of columns agrees in every simulation
- 1
- Start with the 10,000 simulations, one row each.
- 2
-
==compares the two columns row by row. A proportion of 1 means they agree in all 10,000 simulations. - 3
- “At least one has high BP” is a union, which is hard to count directly. De Morgan plus Proposition 1 turns it into 1 minus an intersection: “all do not have high BP”.
# A tibble: 1 × 3
  law_1_agree law_2_agree p_at_least_one_high
        <dbl>       <dbl>               <dbl>
1           1           1               0.876
Exact: \(1 - (0.7)^6 \approx 0.8824\)
We can find the probability of “all do not have high BP” more easily in the coming chapters
Remarks on De Morgan’s Laws
These laws also hold for infinite collections of events.
Draw Venn diagrams to convince yourself that these are true!
These laws are very useful when calculating probabilities.
This is because calculating the probability of the intersection of events is often much easier than the union of events.
This is not obvious right now, but we will see in the coming chapters why.
Learning Objectives
Use set notation, Venn diagrams, and the concepts of unions, intersections, complements, and mutually exclusive events to represent and describe events.
Apply the axioms of probability and related properties to calculate probabilities and prove simple results.
Explain and use De Morgan’s Laws to simplify and solve probability problems.
- Connect partitions and all rules of probability to calculate probabilities.
Partitions
Definition: Partition
A set of events \(\{A_i\}_{i=1}^{n}\) create a partition of \(A\), if
the \(A_i\)’s are disjoint (mutually exclusive) and
\(\bigcup \limits_{i=1}^n A_i = A\)
Note
If \(A \subset B\), then \(\{A, B \cap A^C\}\) is a set of partitions of \(B\).
If \(S = \bigcup \limits_{i=1}^n A_i\), and the \(A_i\)’s are disjoint, then the \(A_i\)’s are a partition of the sample space.
Creating partitions is sometimes used to help calculate probabilities, since by Axiom 3 we can add the probabilities of disjoint events.
Example 3: Weekly medications
If a subject has an
80% chance of taking their medication this week,
70% chance of taking their medication next week, and
10% chance of not taking their medication either week,
then find the probability of them taking their medication exactly one of the two weeks.
Hint: Draw a Venn diagram labelling each of the parts to find the probability.
Checking Example 3 with simulation
- After solving with the Venn diagram: simulate the four disjoint pieces (a partition of the sample space) and check the given facts
cells <- c("both", "this only", "next only", "neither")
med_sims <- expand_grid(sim = 1:reps) |>
mutate(cell = sample(cells, n(), replace = TRUE,
prob = c(0.6, 0.2, 0.1, 0.1)))
med_sims |>
summarise(p_this = mean(cell %in% c("both", "this only")),
p_next = mean(cell %in% c("both", "next only")),
p_neither = mean(cell == "neither"),
p_exactly_one = mean(cell %in% c("this only", "next only")))- 1
- The four pieces of the Venn diagram. They are disjoint and together make up the whole sample space, so they form a partition.
- 2
-
One row per simulation. With only one thing to simulate per week pair,
expand_grid()just needssim. - 3
- Each simulation lands in exactly one piece, with the probabilities from our Venn diagram.
- 4
-
%in%checks ifcellis any of the listed pieces. “Took it this week” is the union of two disjoint pieces, so by Axiom 3 its probability is their sum. - 5
- Our answer: “exactly one week” is the union of the two “only” pieces.
# A tibble: 1 × 4
  p_this p_next p_neither p_exactly_one
   <dbl>  <dbl>     <dbl>         <dbl>
1  0.797  0.696     0.105         0.297
- The first three columns should be close to the 0.8, 0.7, and 0.1 we were given. If they are, our partition is right, and the last column checks our answer.
Lesson 3 Slides