Lesson 1: Data collection
2025-09-29
Where are we?
Sampling methods: Basic approaches
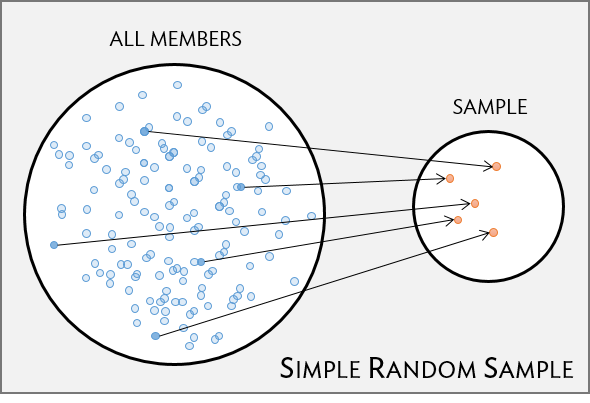
Simple random sample (SRS)
- Each individual of a population has the same chance of being sampled
- Randomly sampled
- Considered best way to sample
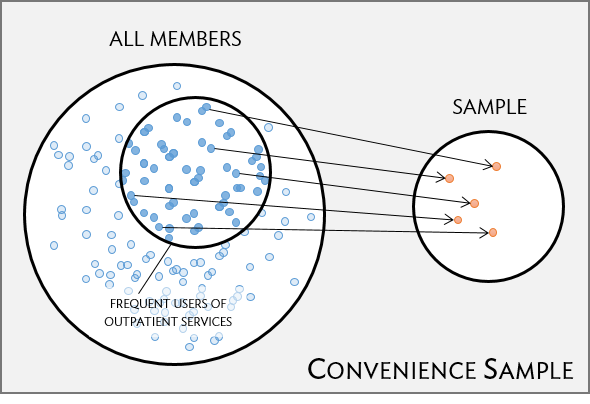
Convenience sample
- Easily accessible individuals are more likely to be included in the sample than other individuals
- A common “pitfall”
Potential bias with sampling
Good sampling plans don’t guarantee samples representative of the population
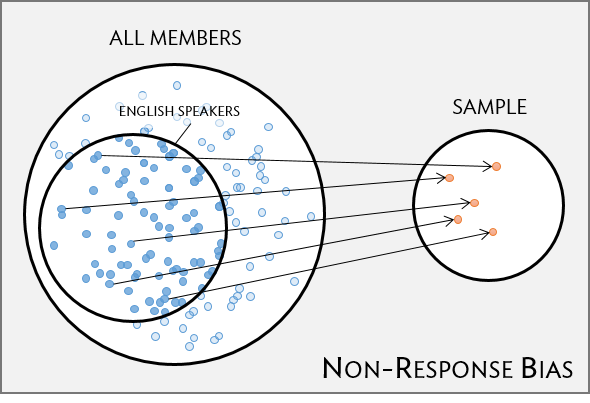
Non-response bias
- Are all groups within a population being reached?
- Unrepresentative sample can skew results
- Example: survey only administered in English can lead to non-response bias that under-represents individuals who do not fluently speak English
- Here, bias is stemming from an oversight on the way we are administering our survey (not from the sampling mechanism itself)
Sampling methods (1/2)
- Simple random sample (SRS)
- Each individual of a population has the same chance of being sampled
- Statistical methods taught in this class assume a SRS!
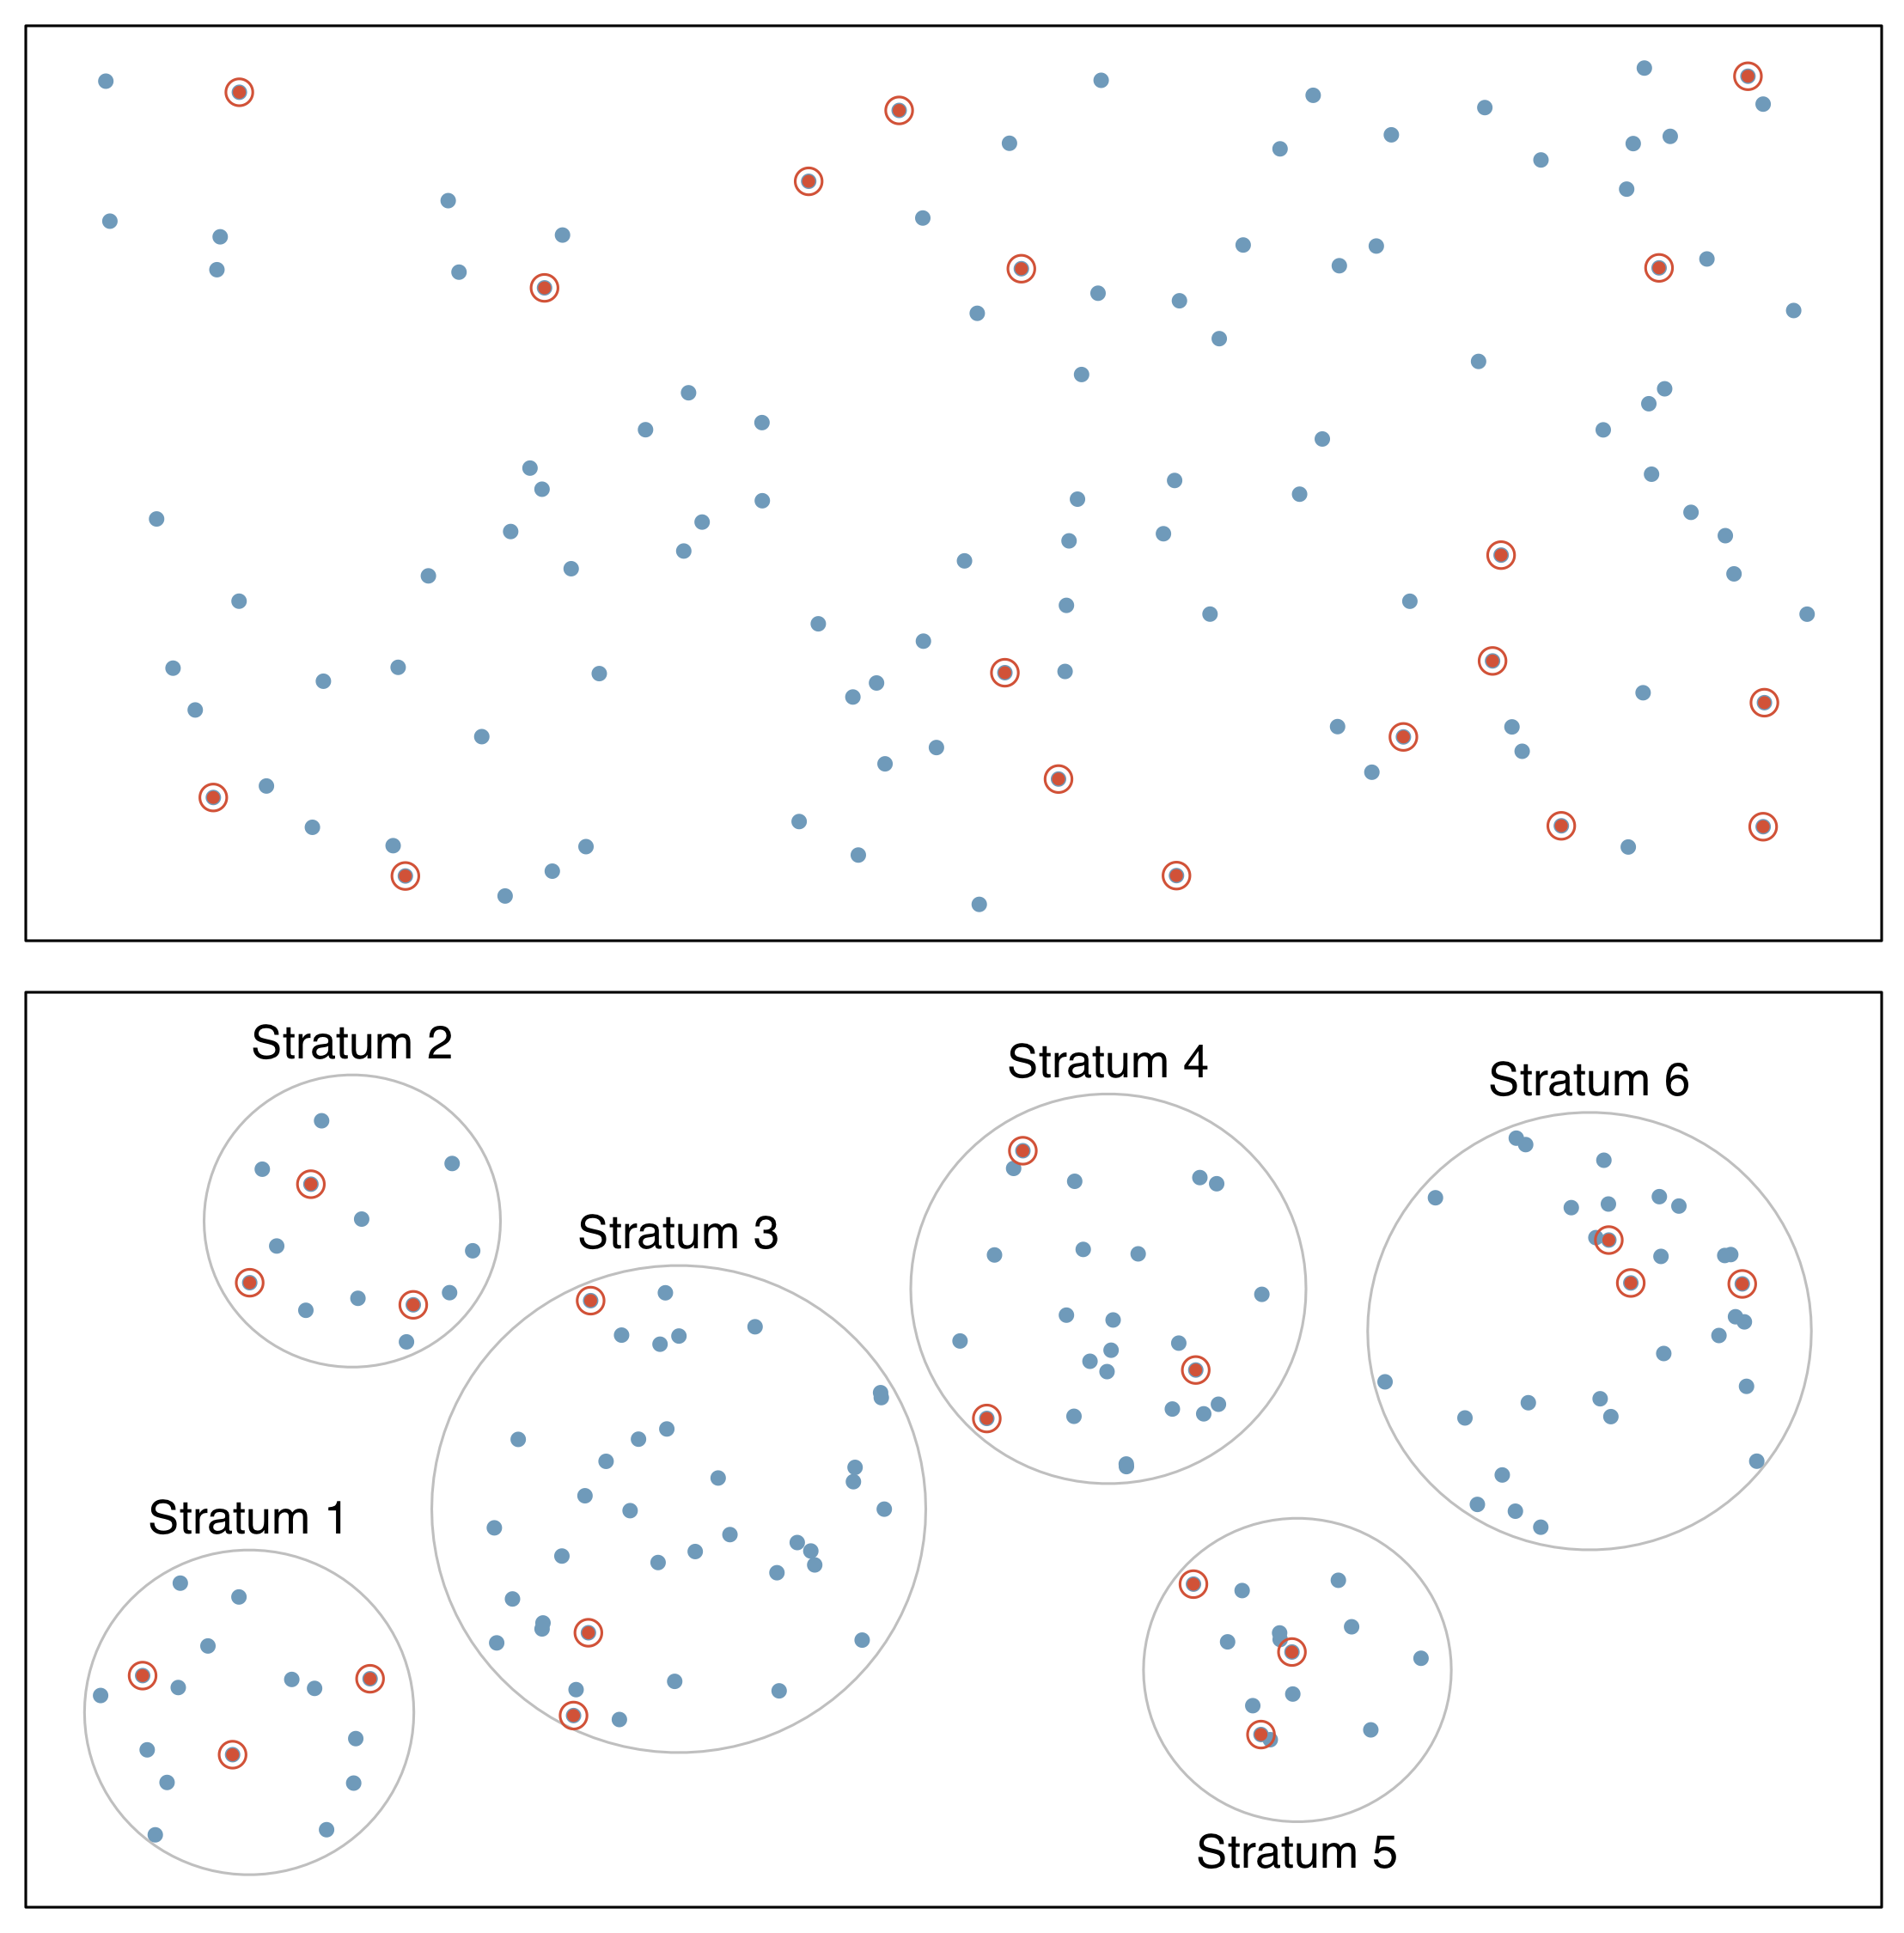
- Stratified sampling
- Divide population into groups (strata) before selecting cases within each stratum (often via SRS)
- Usually cases within a strata are similar, but are different from other strata with respect to the outcome of interest, such as gender or age groups
Sampling methods (2/2)
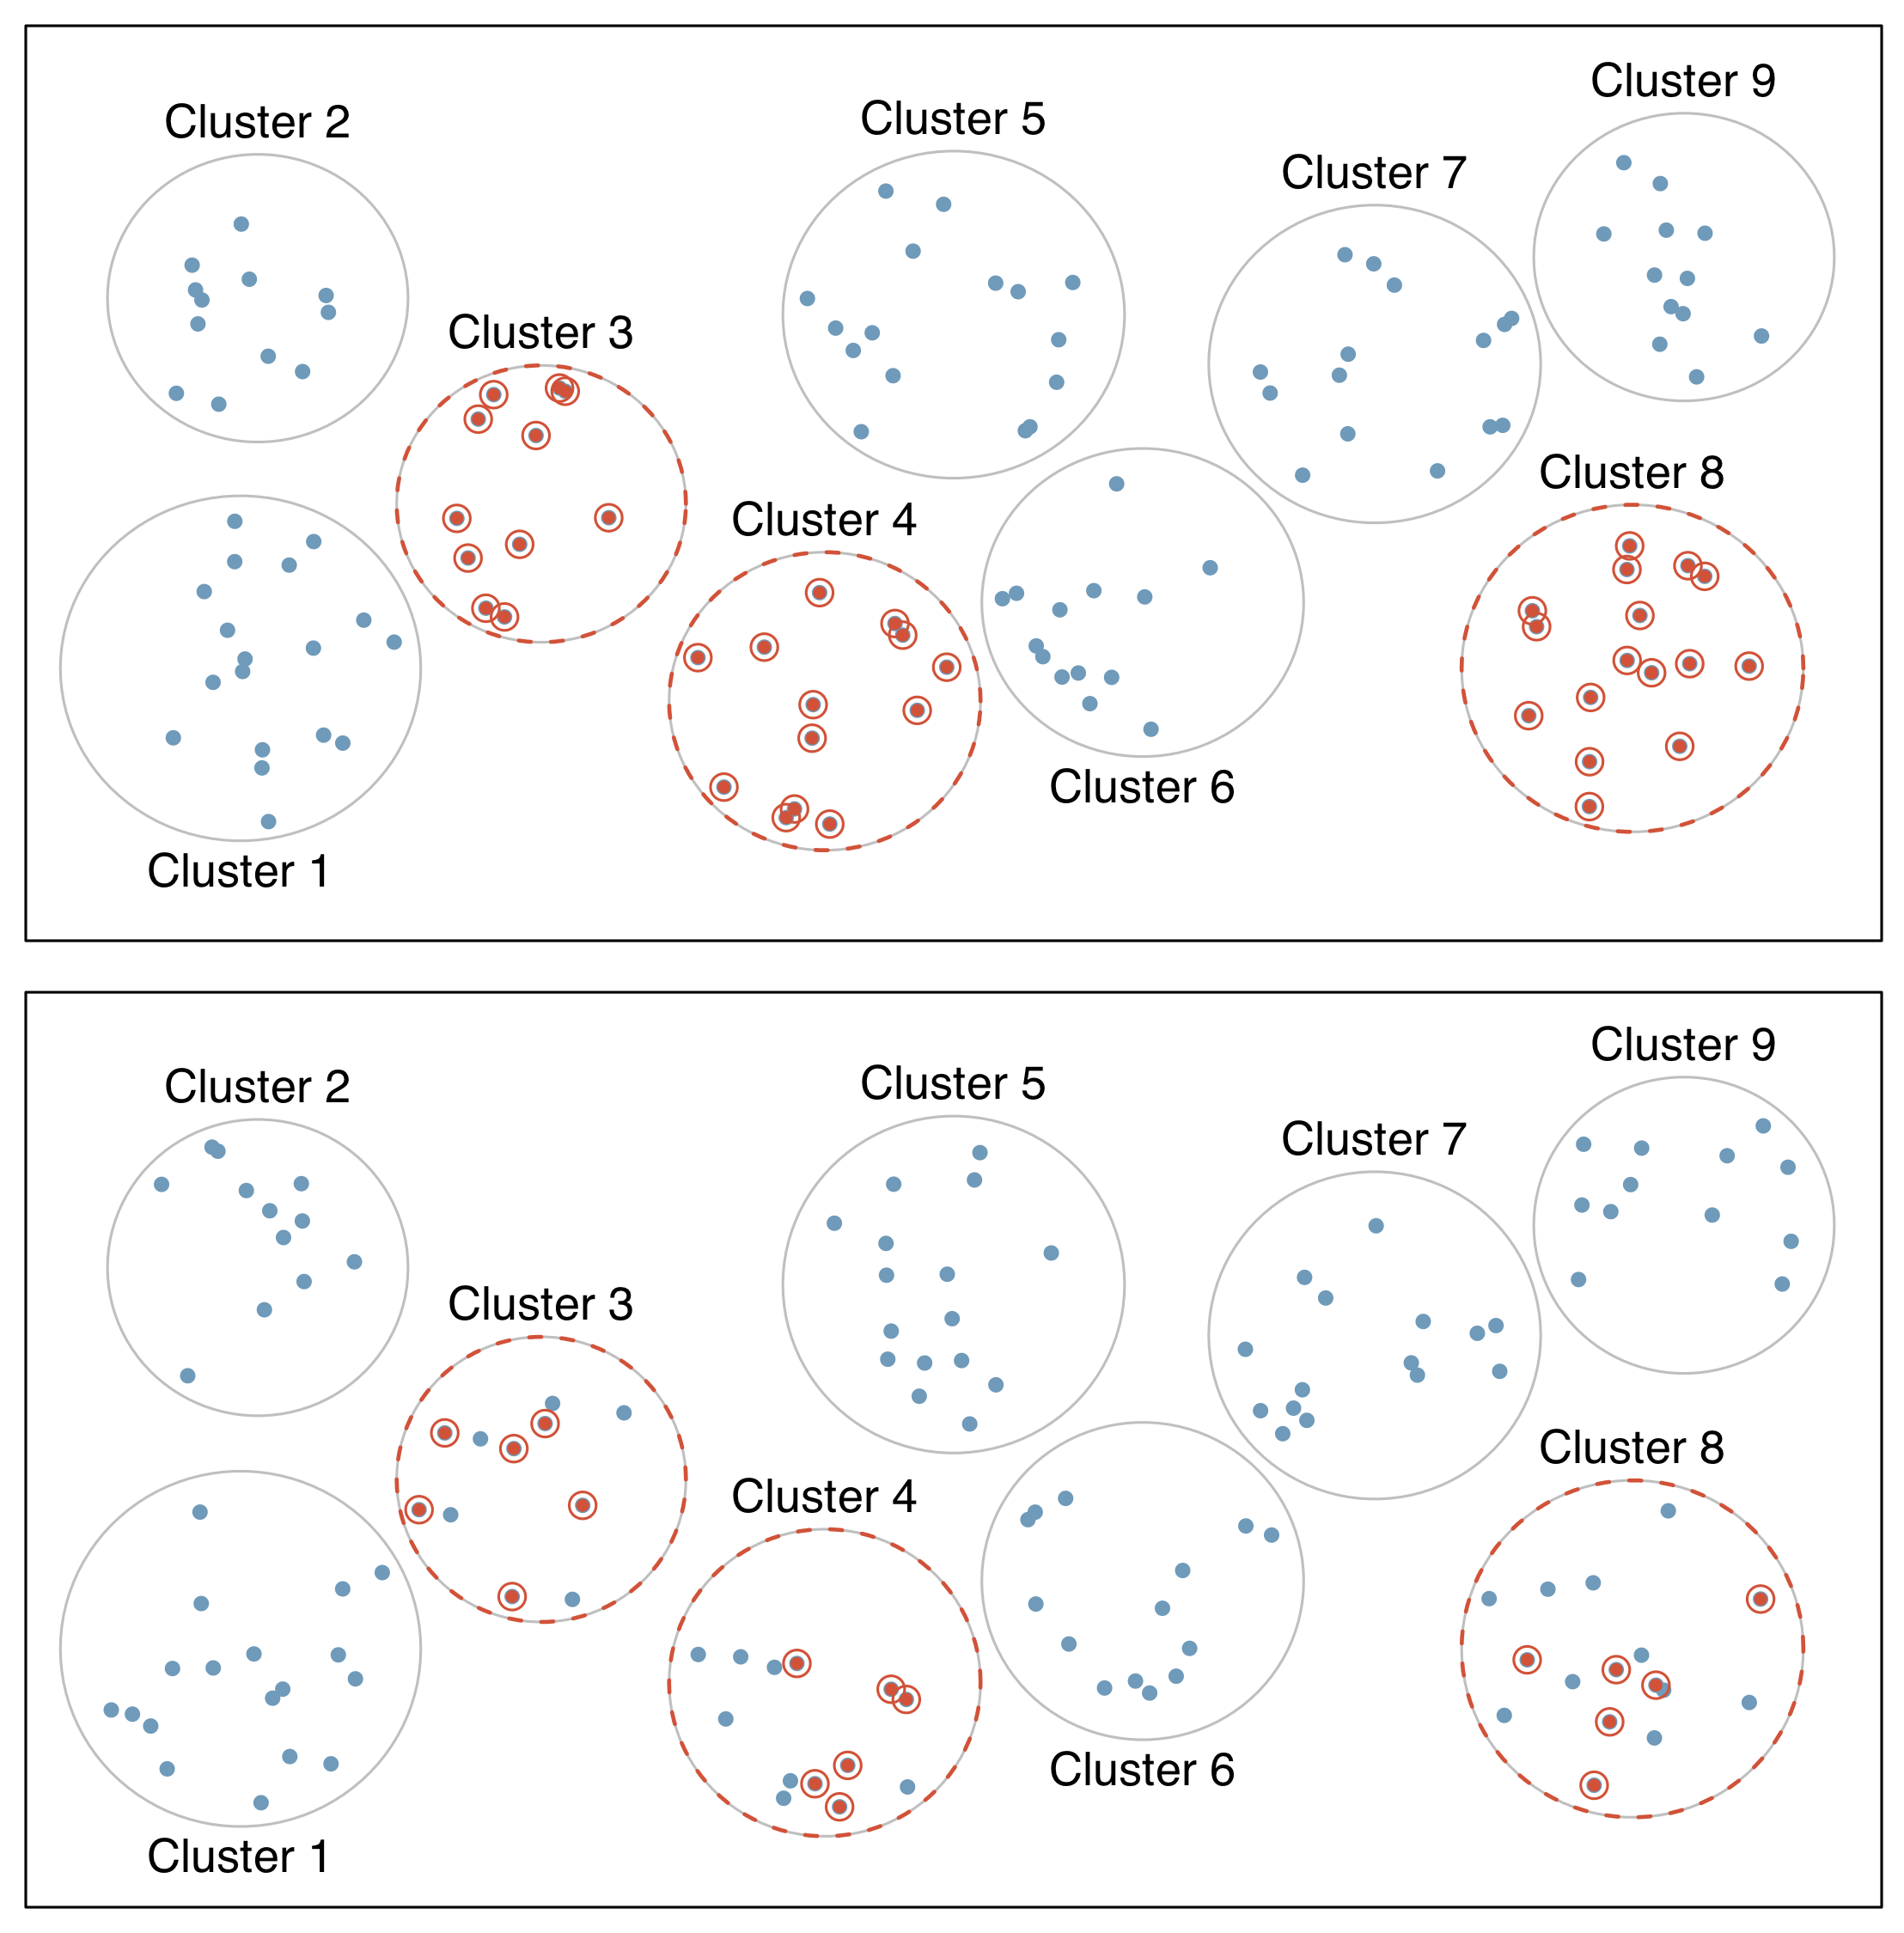
- Cluster sample
- First divide population into groups (clusters)
- Then sample a fixed number of clusters, and include all observations from chosen clusters
- Clusters are often hospitals, clinicians, schools, etc., where each cluster will have similar services/ policies/ etc.
- Usually cases within clusters are diverse
- Multistage sample
- Similar to a cluster sample, but select a random sample within each selected cluster instead of all individuals
- Stacking random samples: first randomly select clusters, then randomly select individuals within each selected cluster
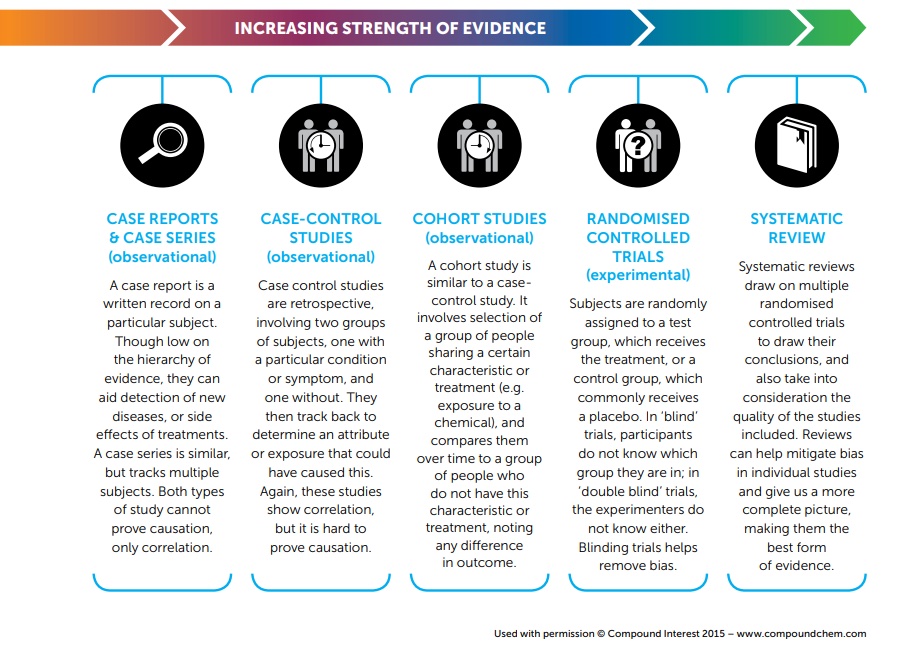
Comparing study designs