TB sections 5.4
2025-11-17
Single-sample mean:
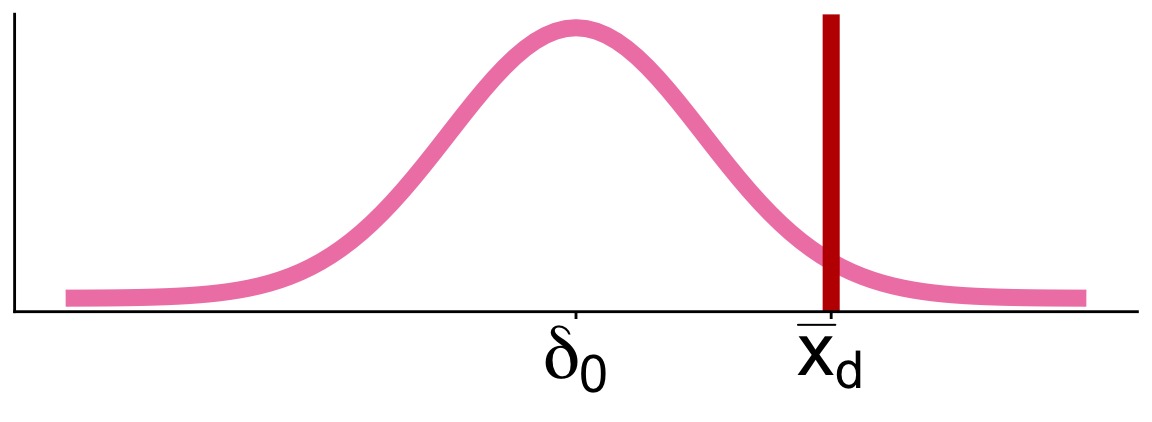
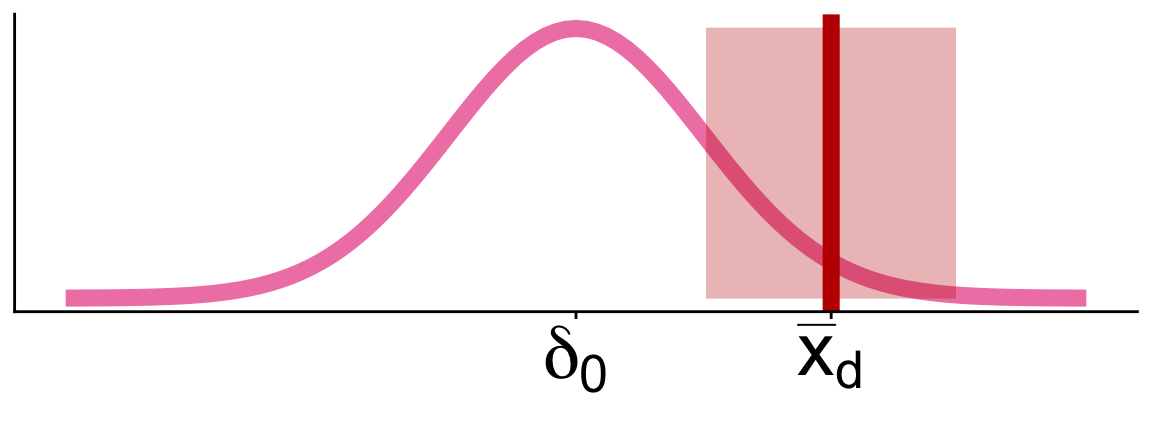
Paired mean difference:
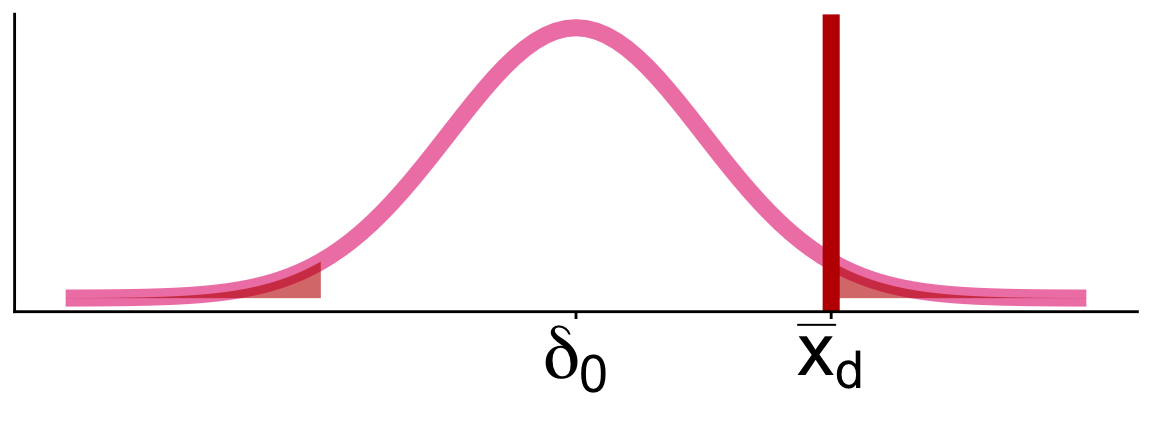
Diff in means of 2 ind samples:
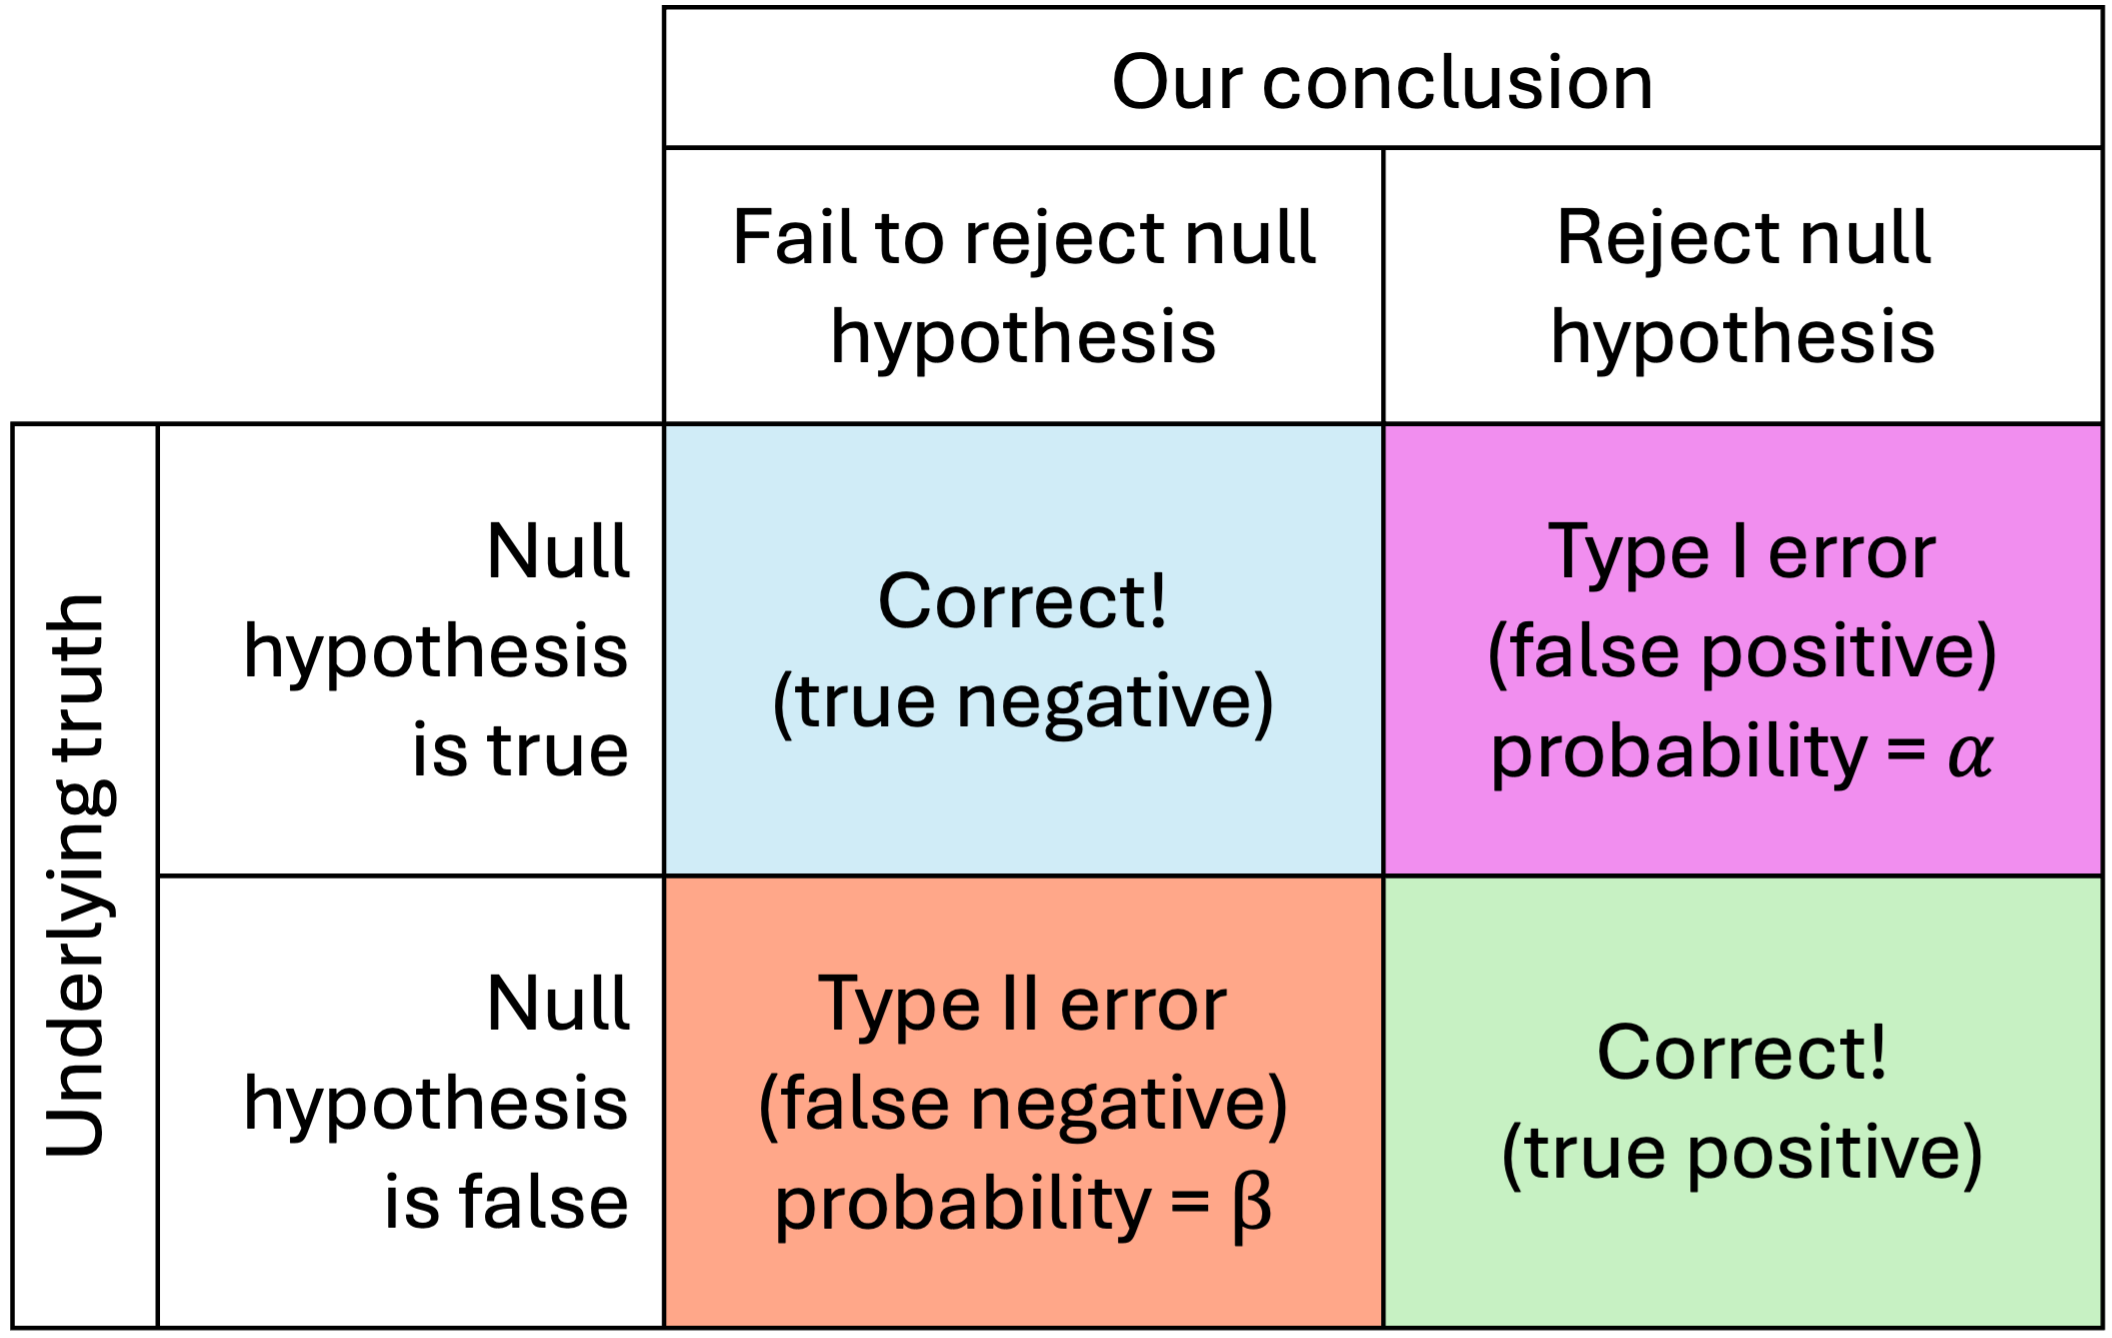

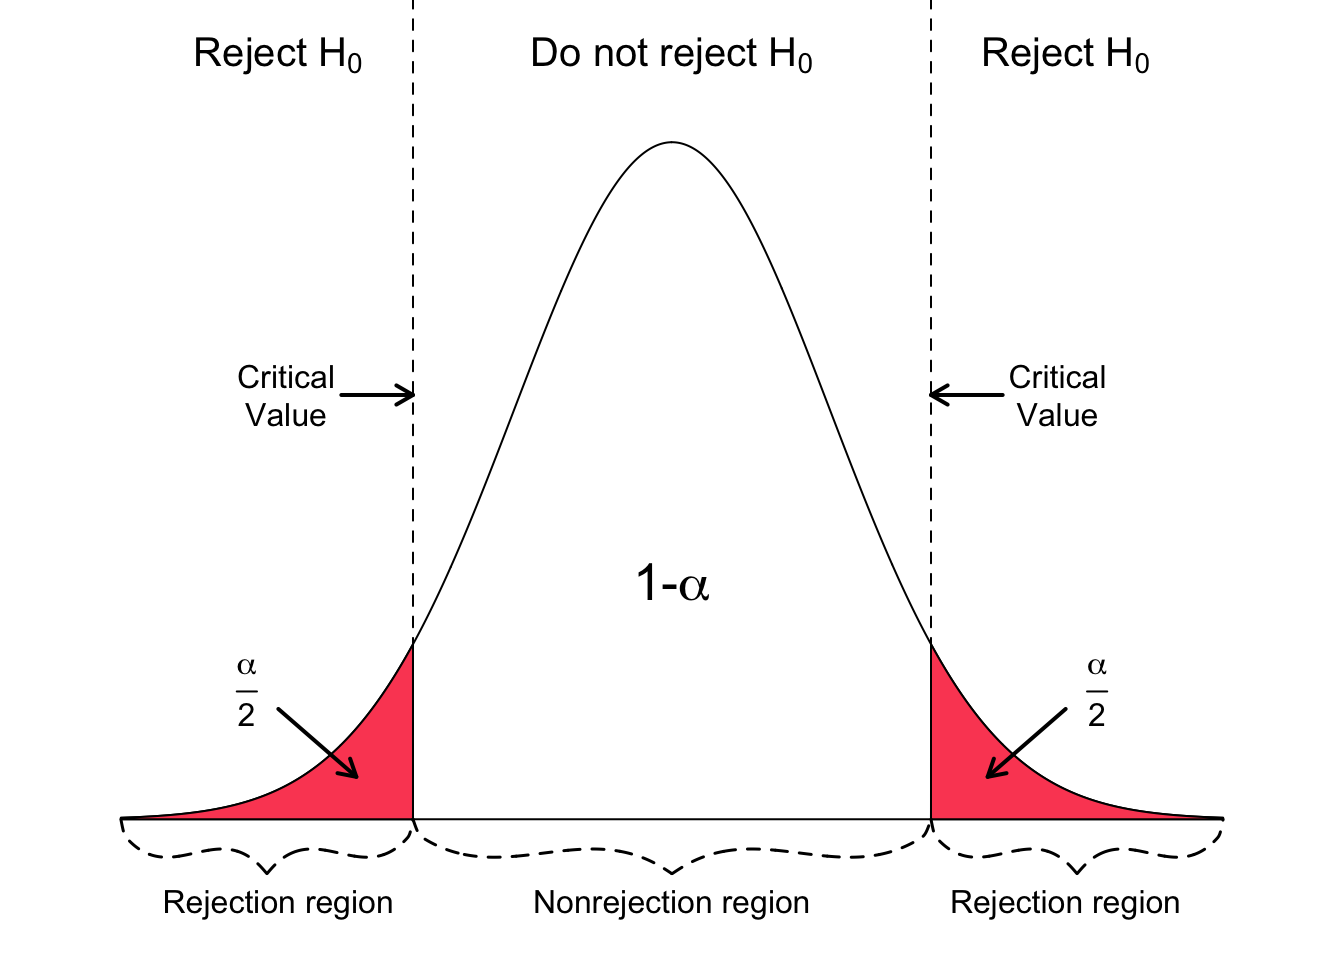
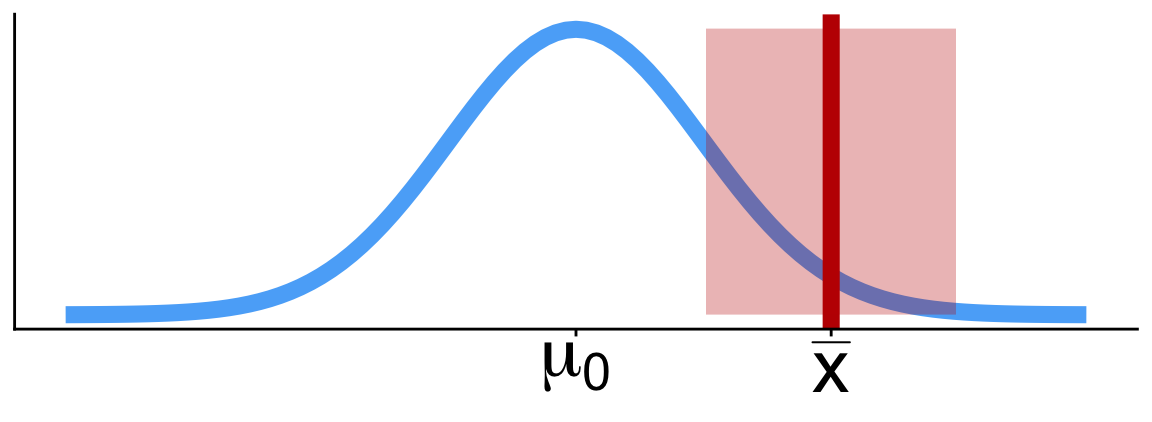
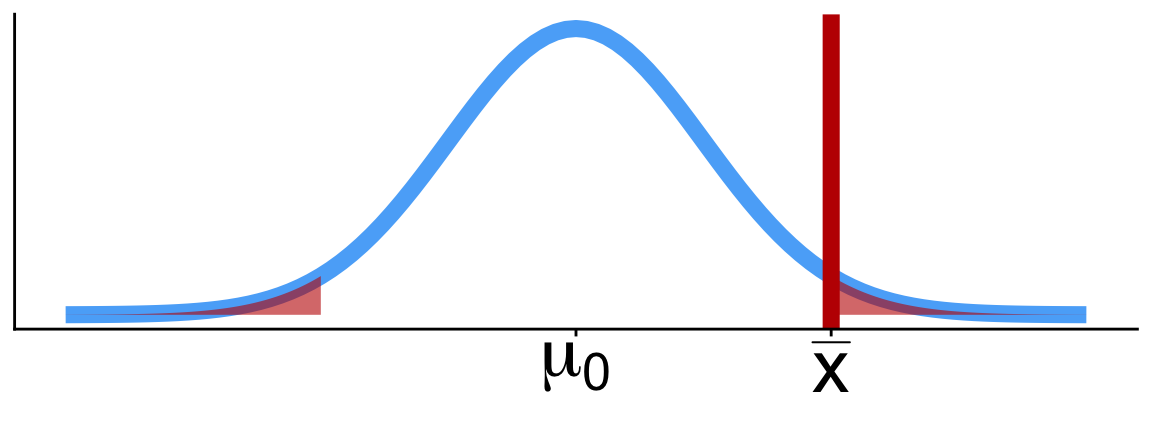
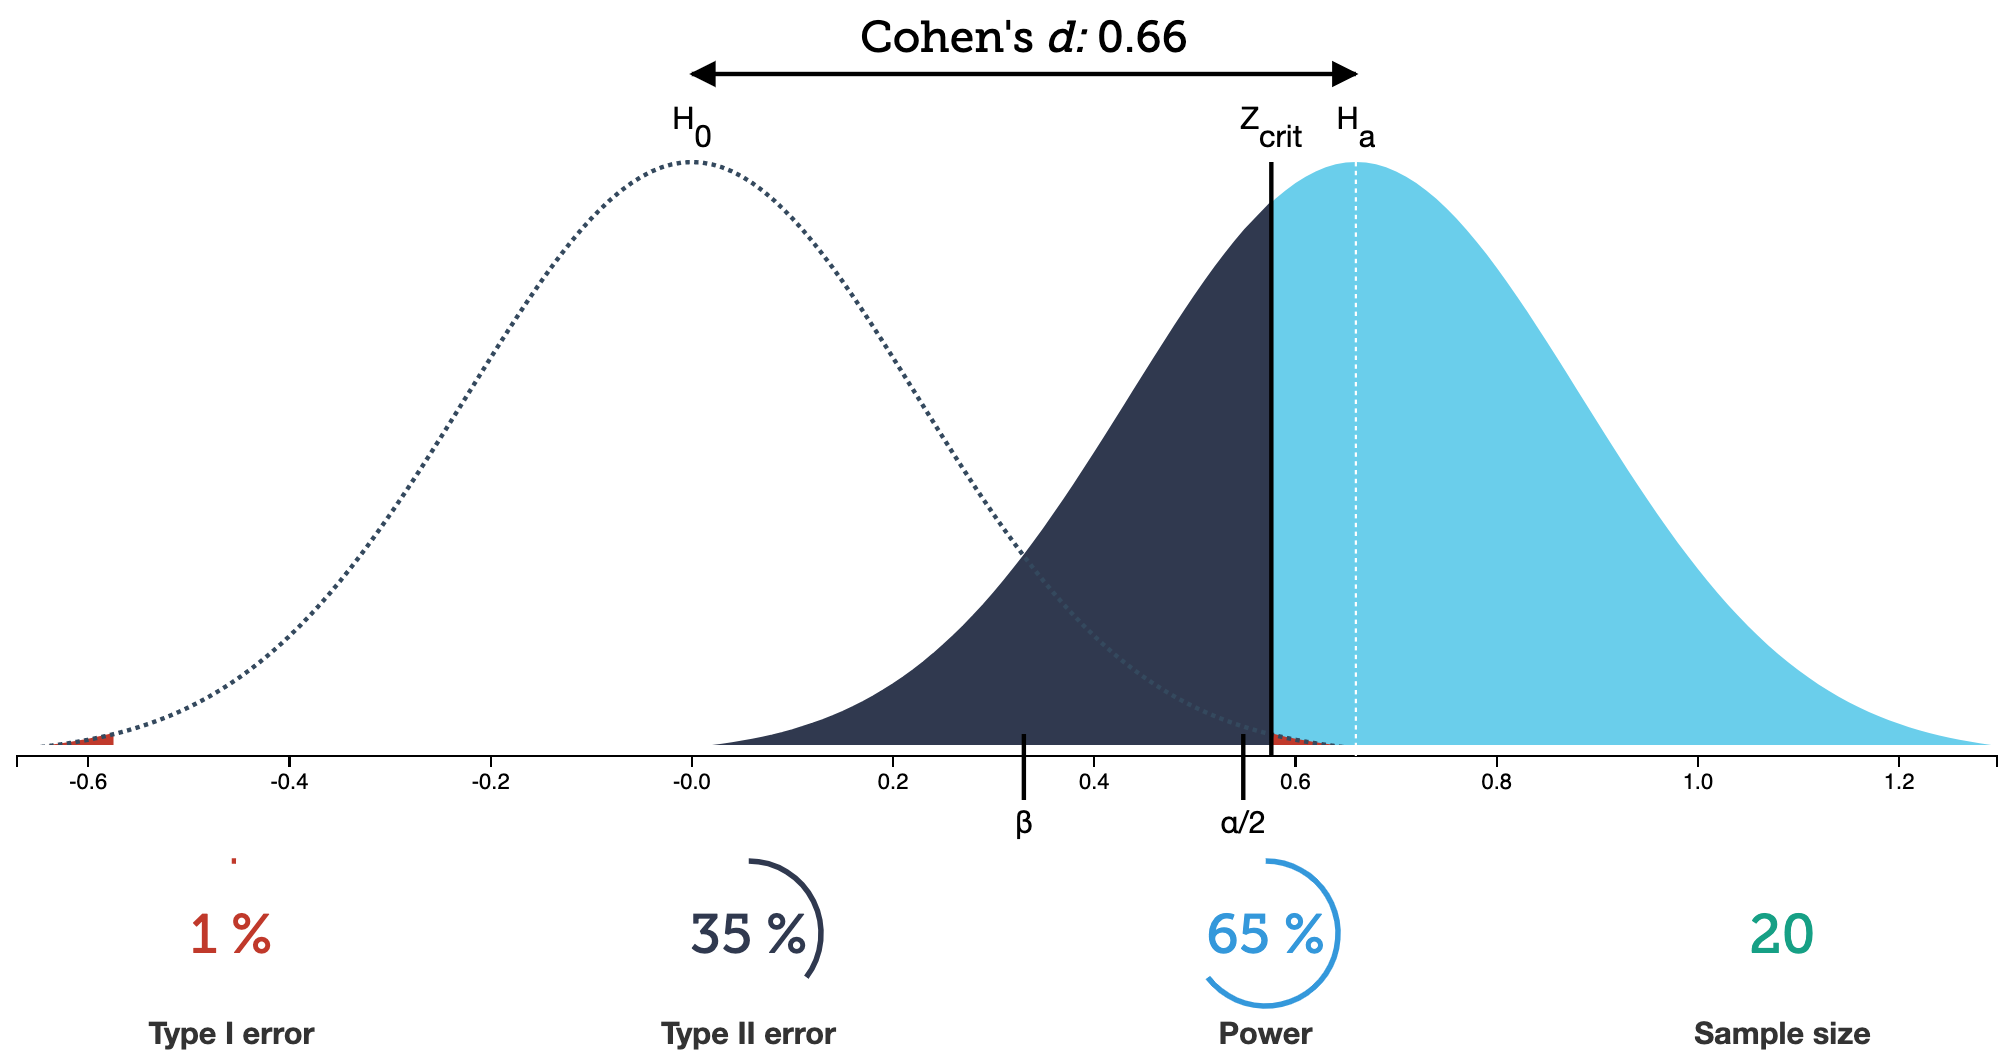
Power (or sensitivity) (\(1 - \beta\)): Probability of rejecting the null hypothesis given that the null is false (correct)
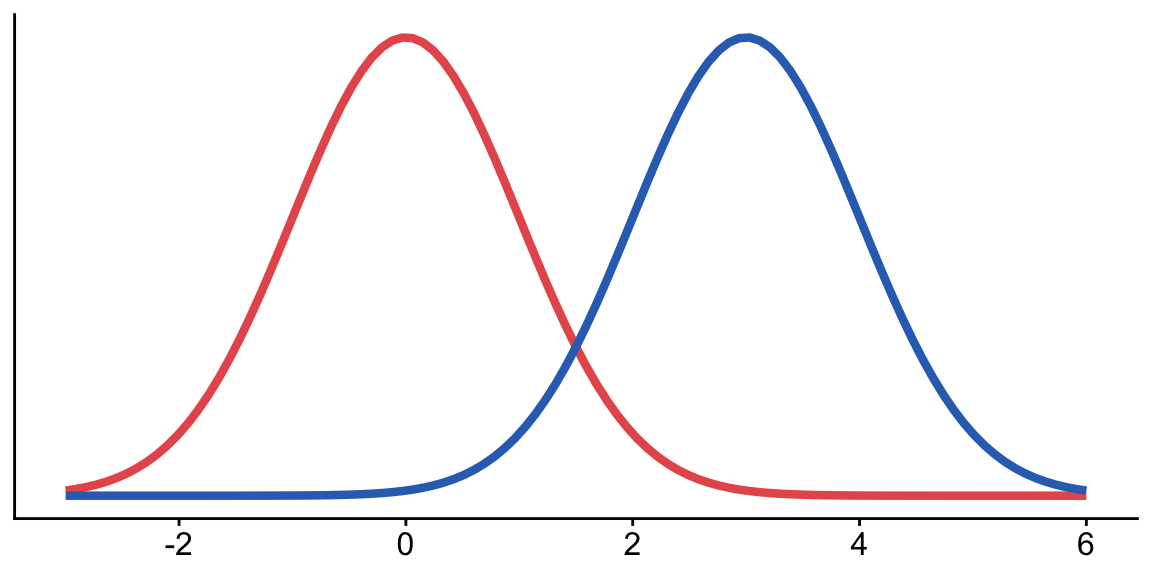
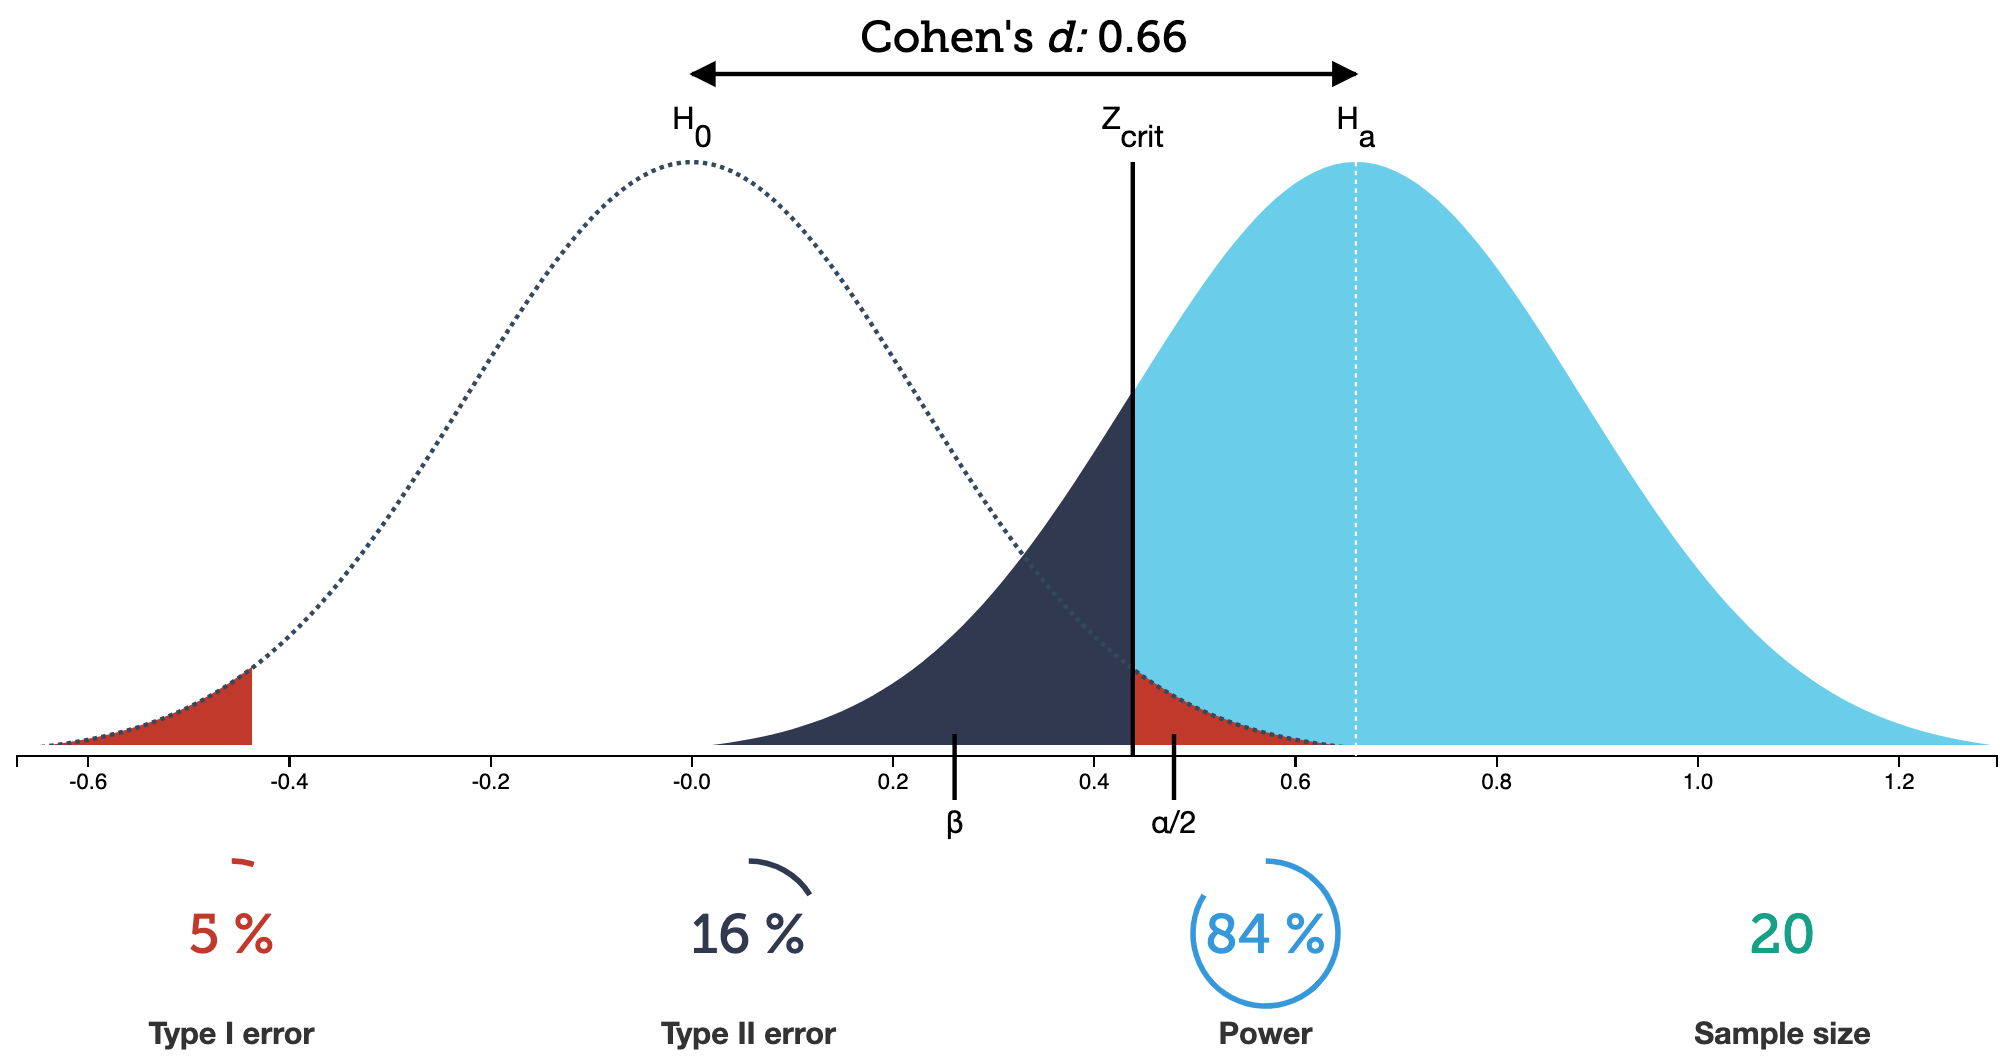
From the applet at https://rpsychologist.com/d3/NHST/
Let’s say we have:
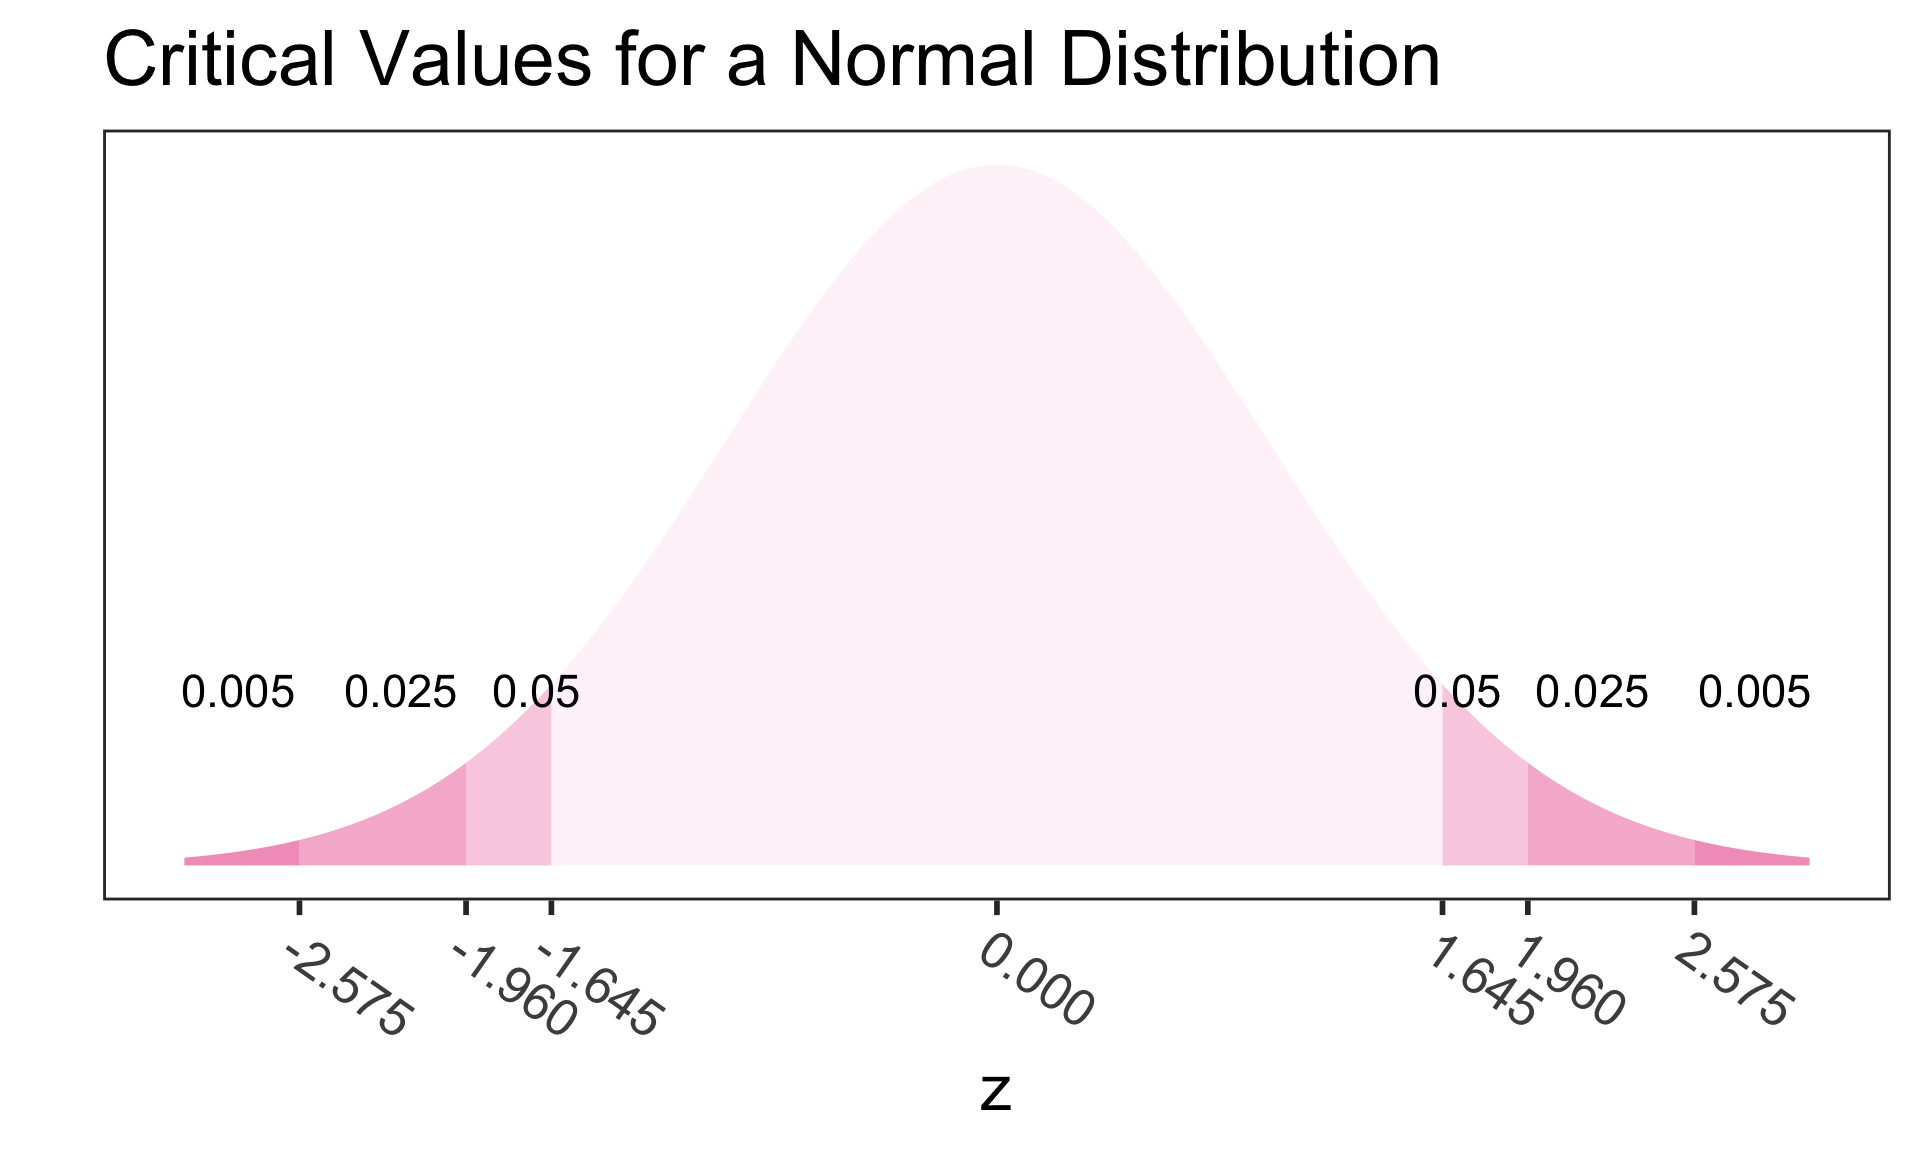
Find the power of a 2-sided test if the actual mean is \(3\) and our significance level is 0.05.
Let’s say we have:
Find the power of a 2-sided test if the actual mean is \(3\) and our significance level is 0.05.
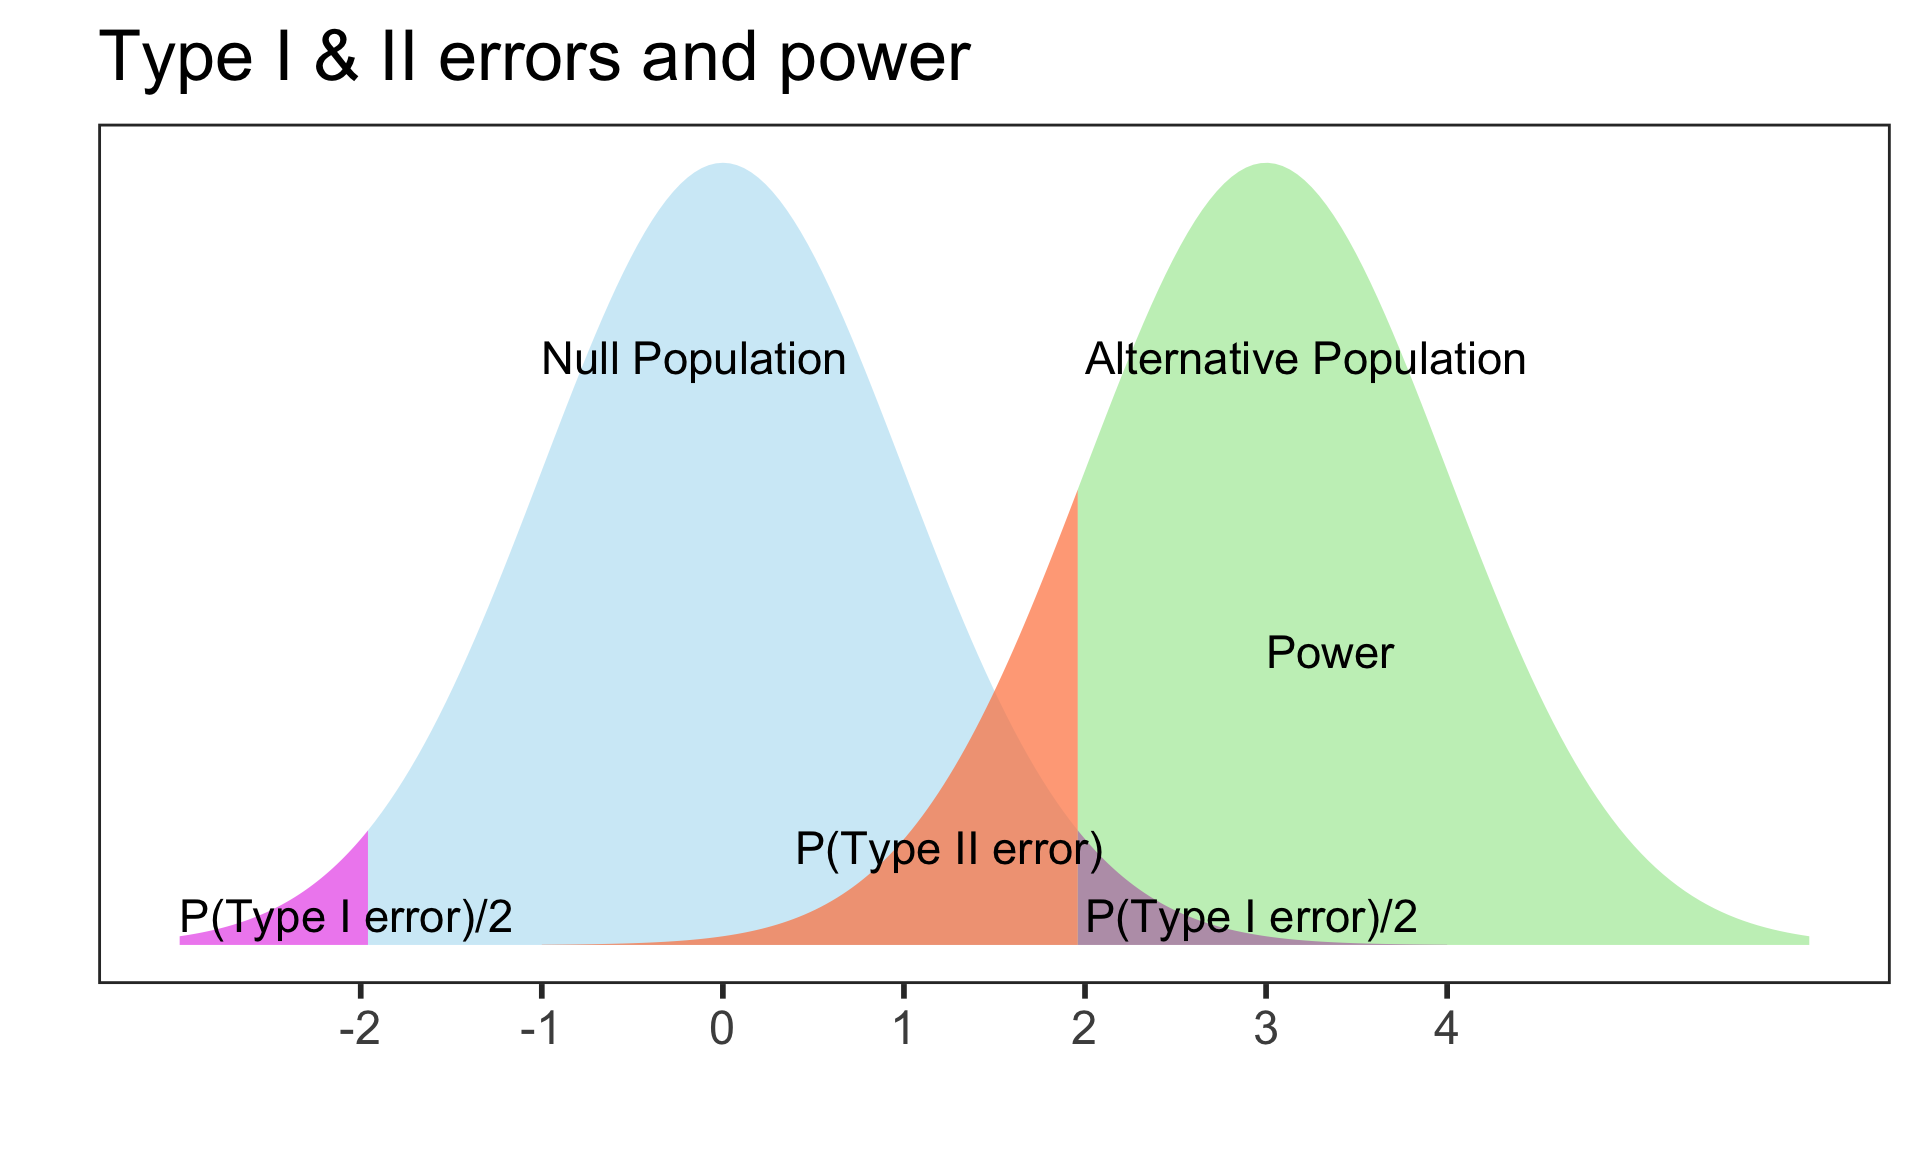
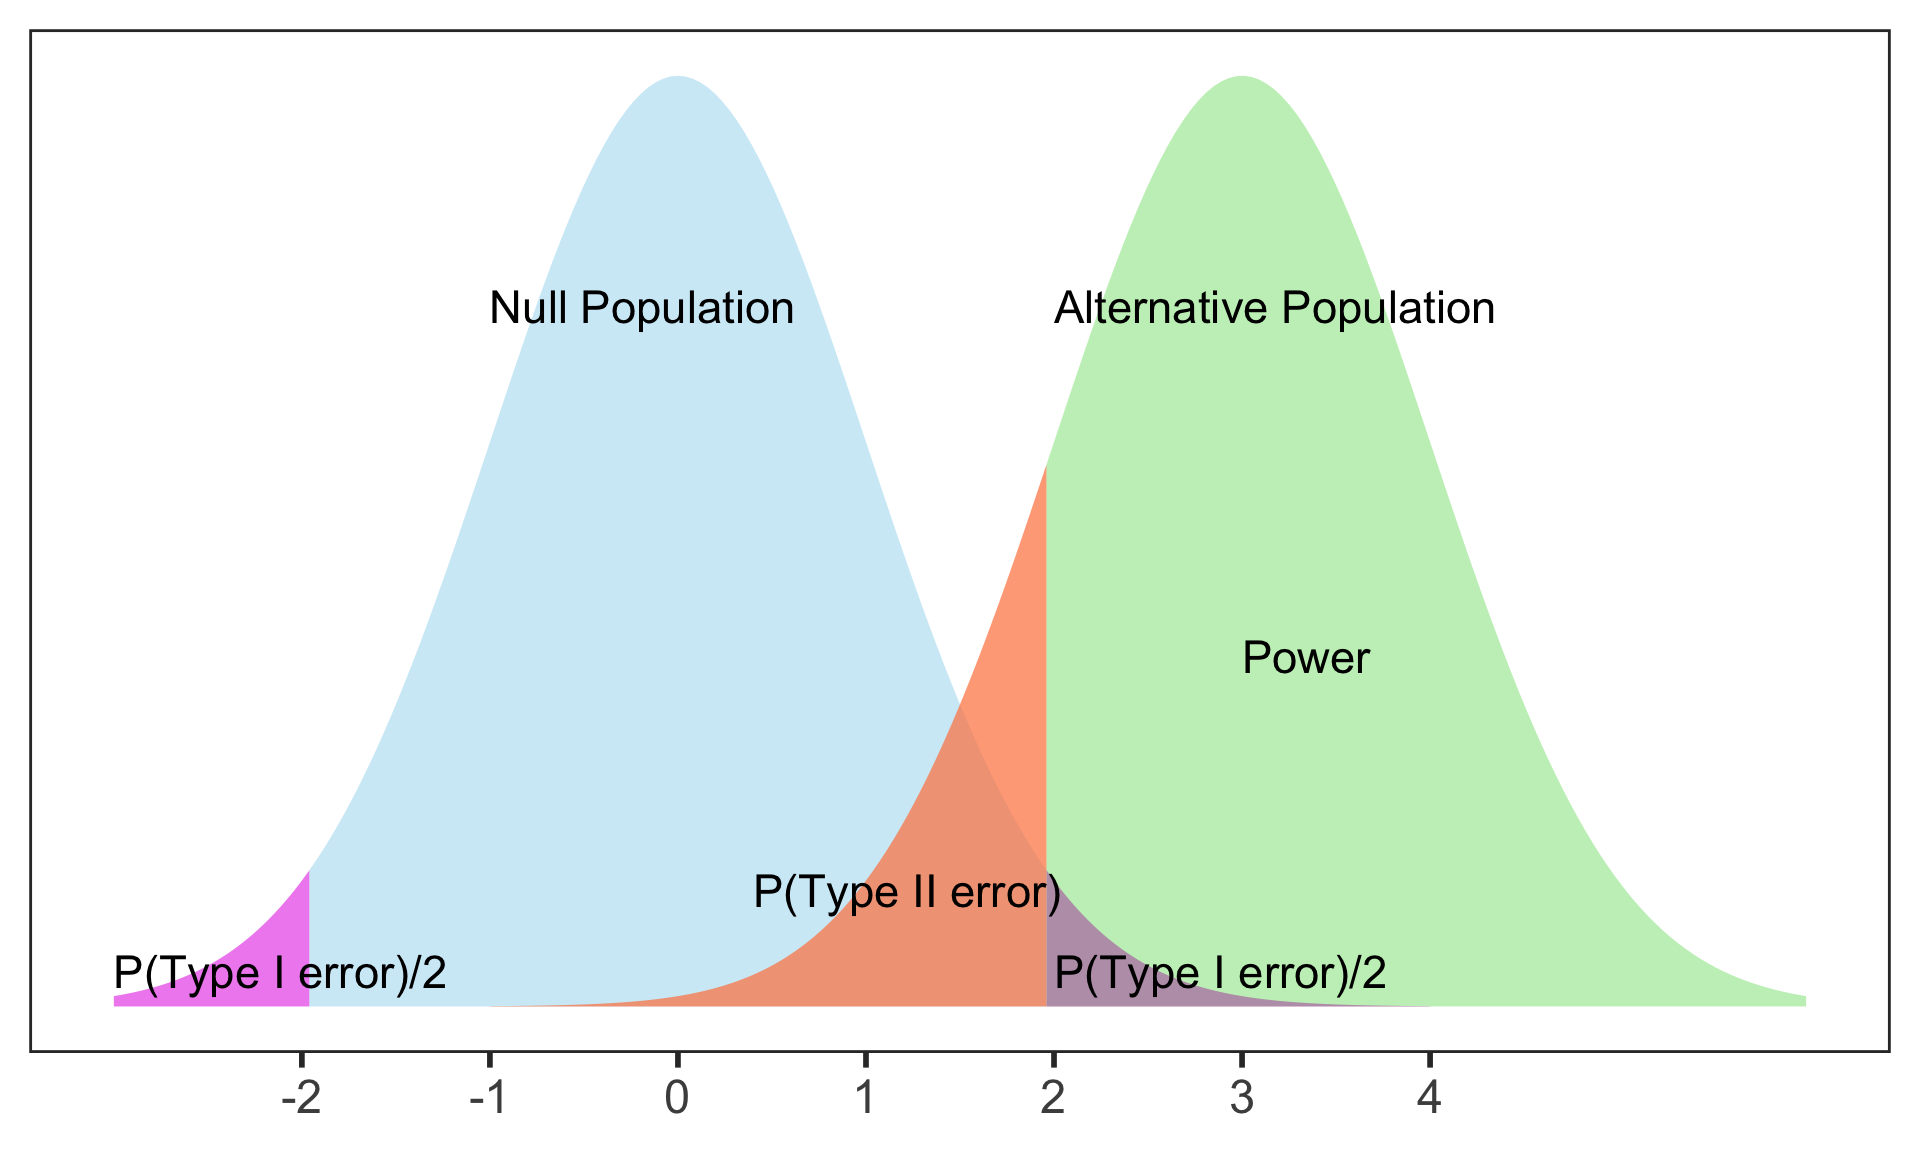
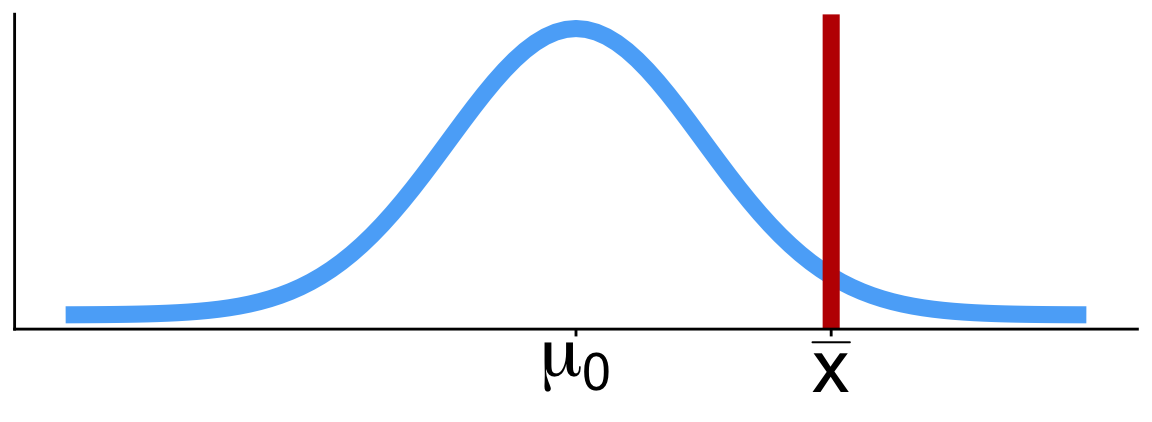
Thus under the alternative population, we need to calculate \(P(X_A \le -1.96) + P(X_A \ge 1.96)\)
Under the alternative population we have \(X_A \sim Norm(3,1)\)
[1] 0.8508304Answer: The power is 85%
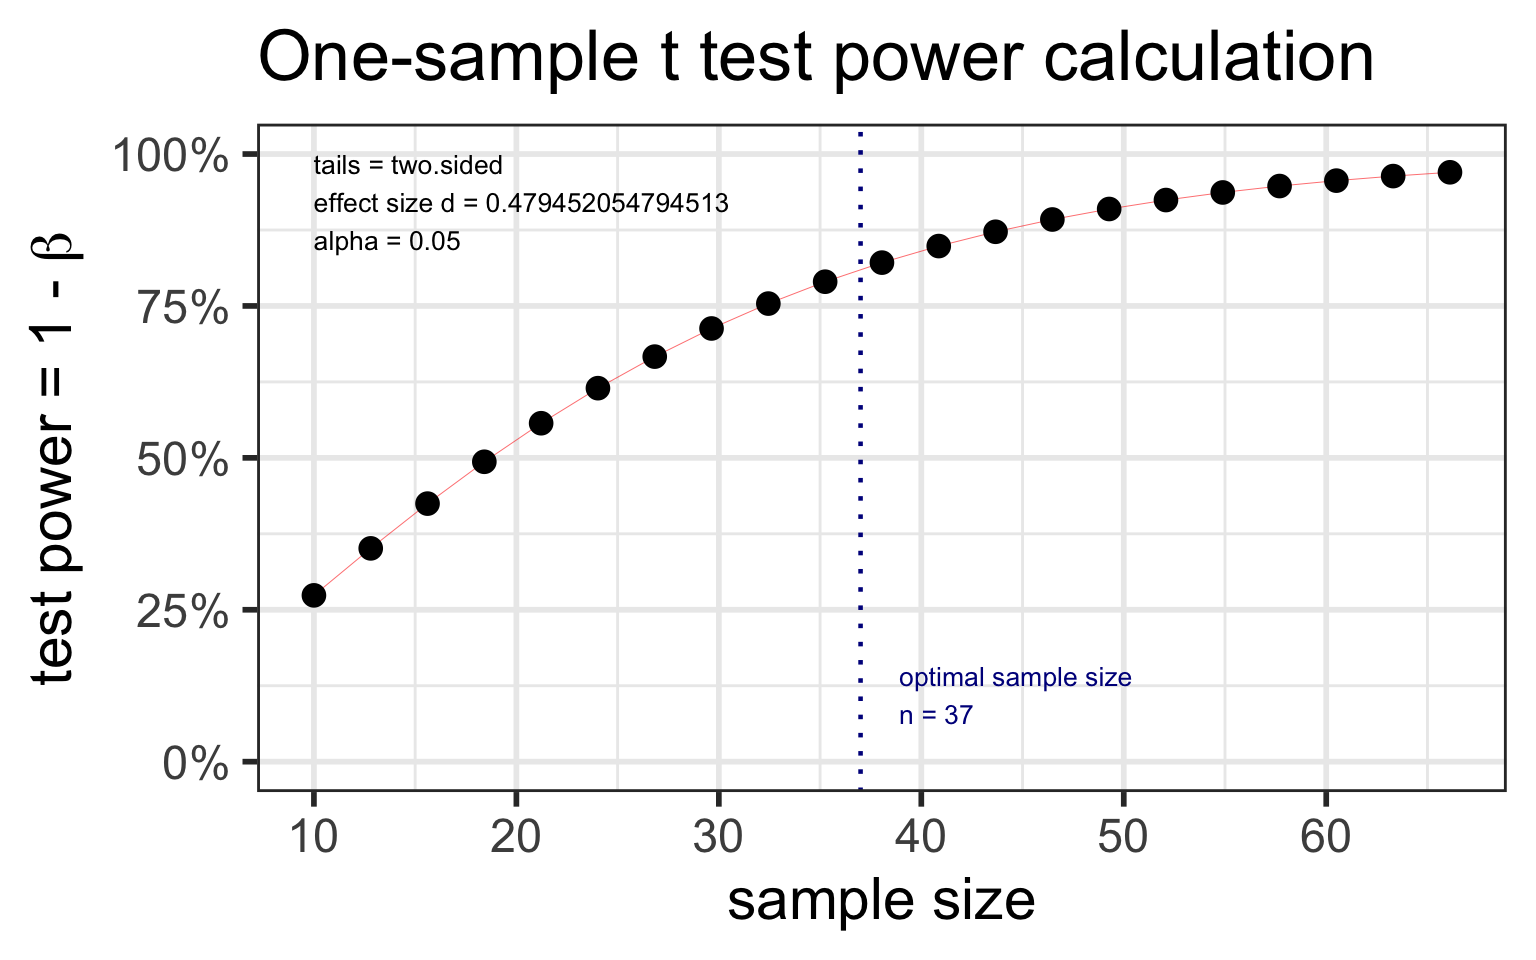
pnorm(-1.96, mean=3, sd=1, lower.tail=TRUE) is essentially 0 in this case.pwr: sample size for one mean testSpecify all parameters except for the sample size:
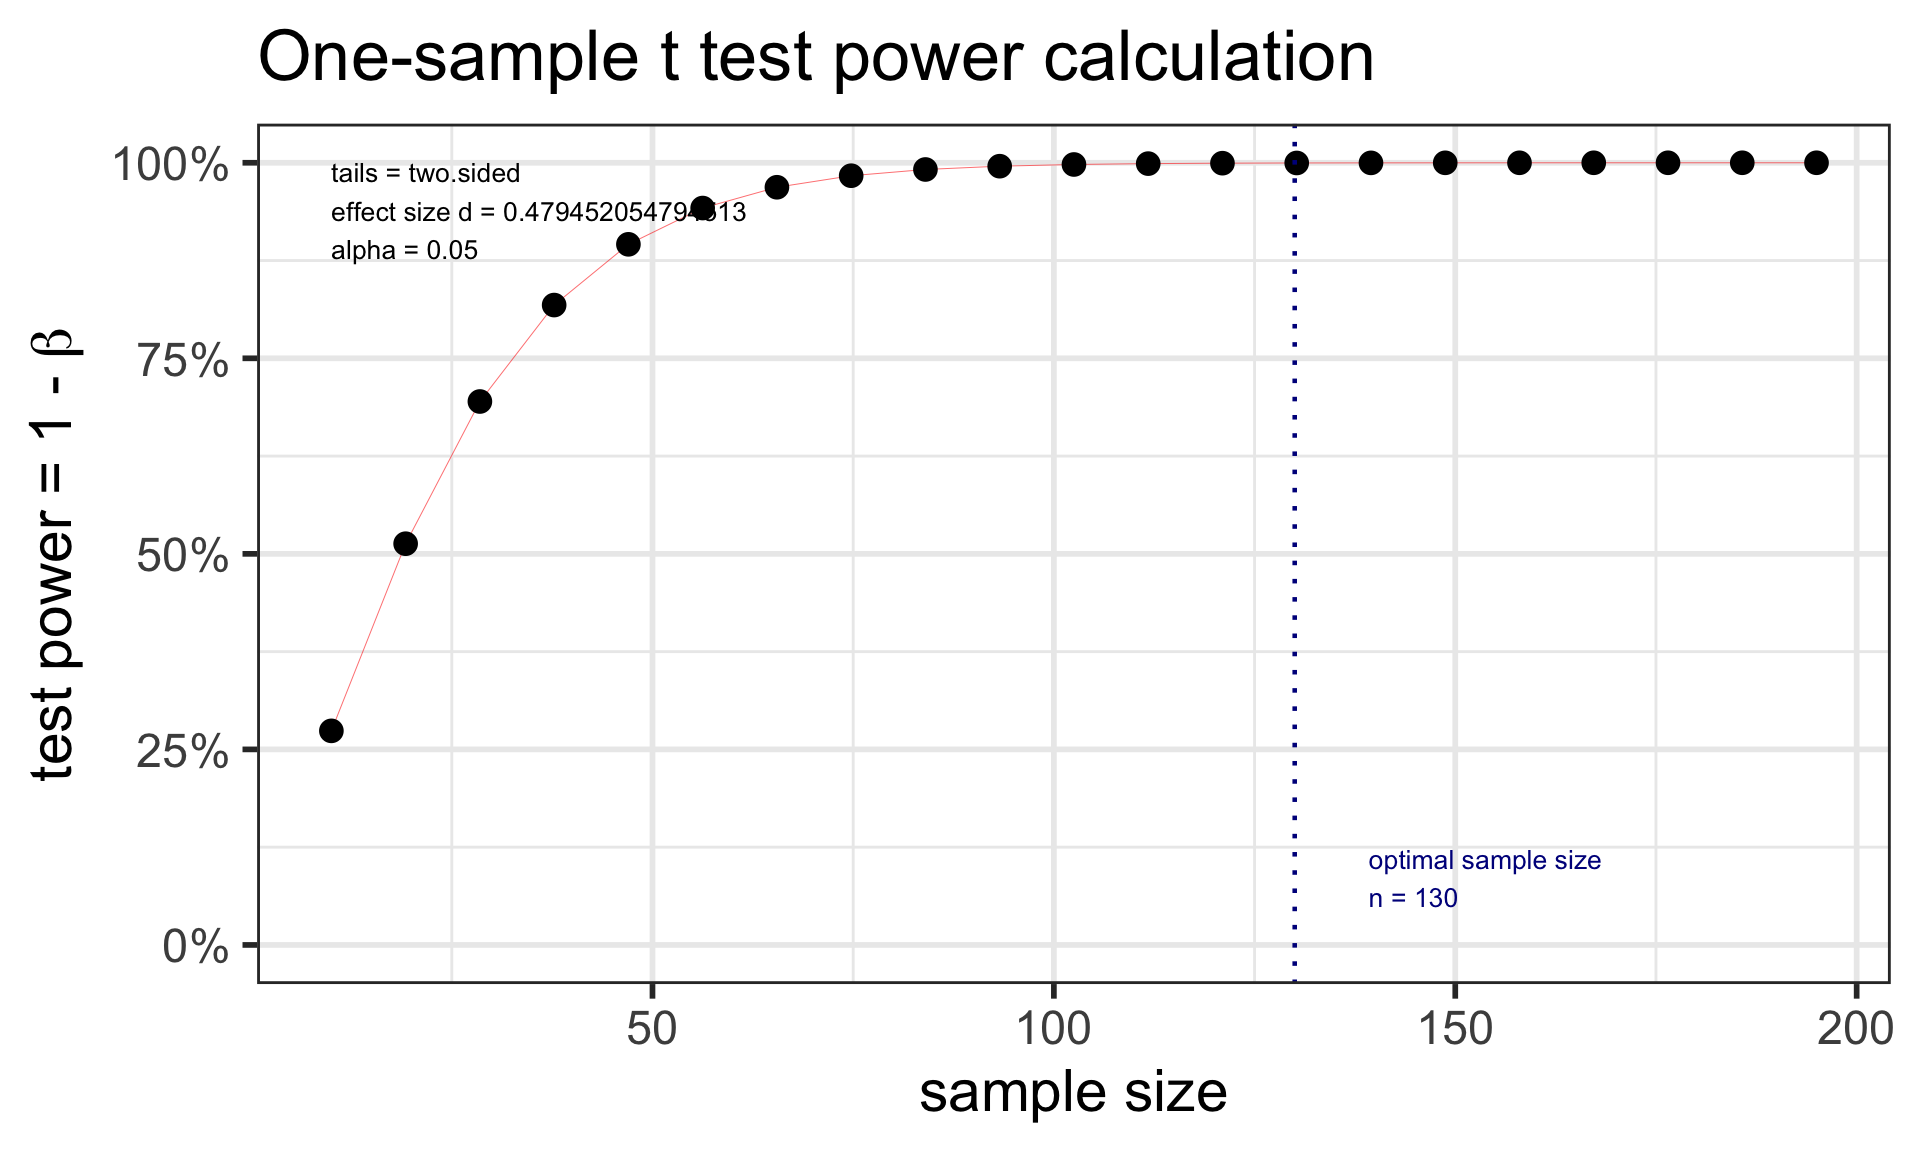
pwr: power for one mean testSpecify all parameters except for the power:
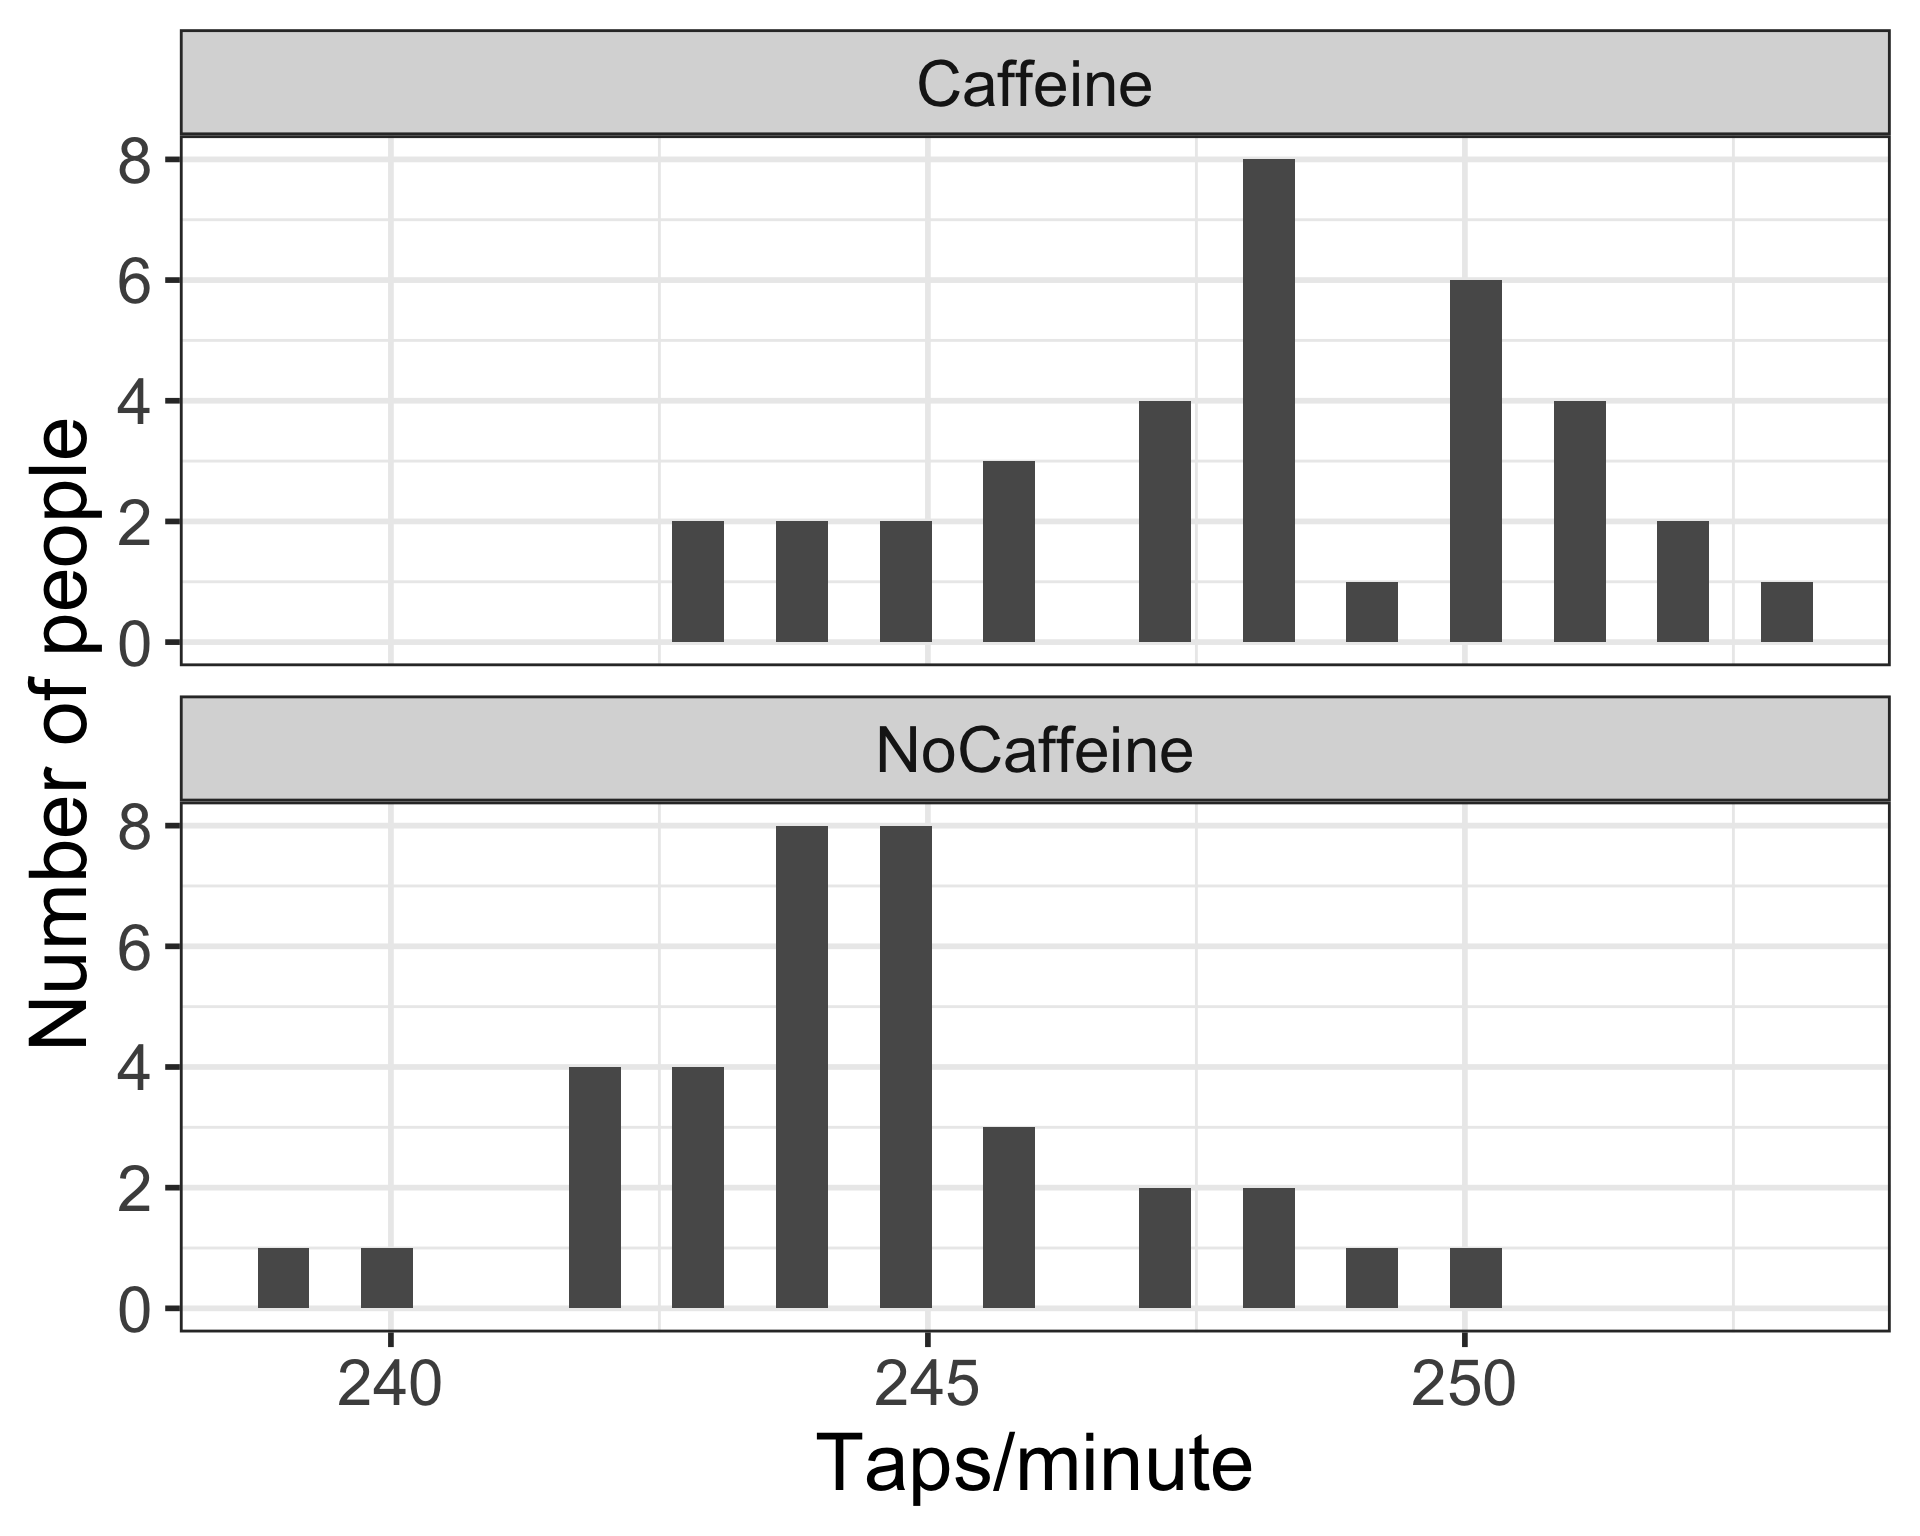
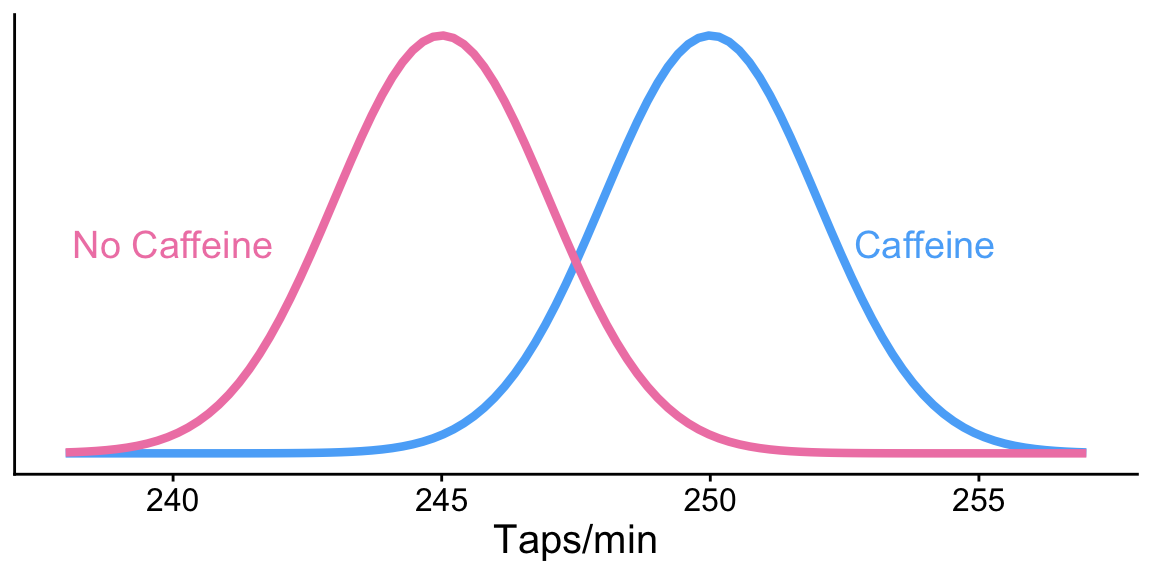
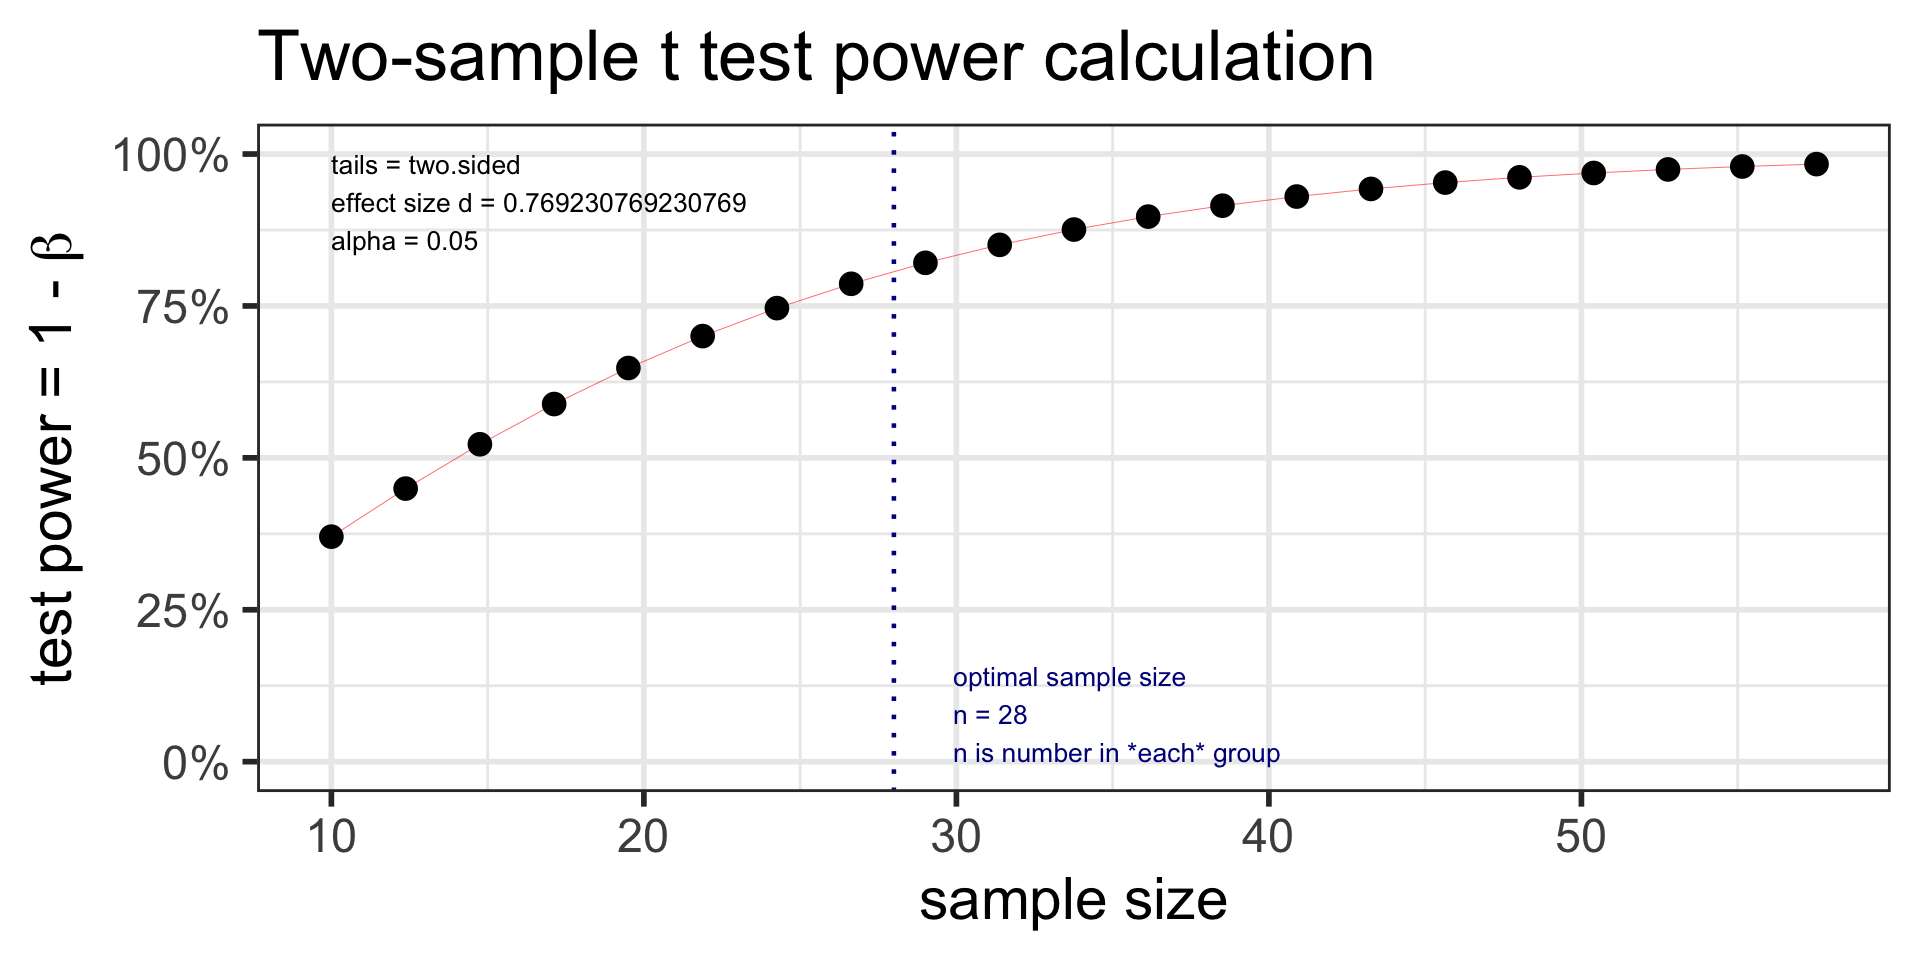
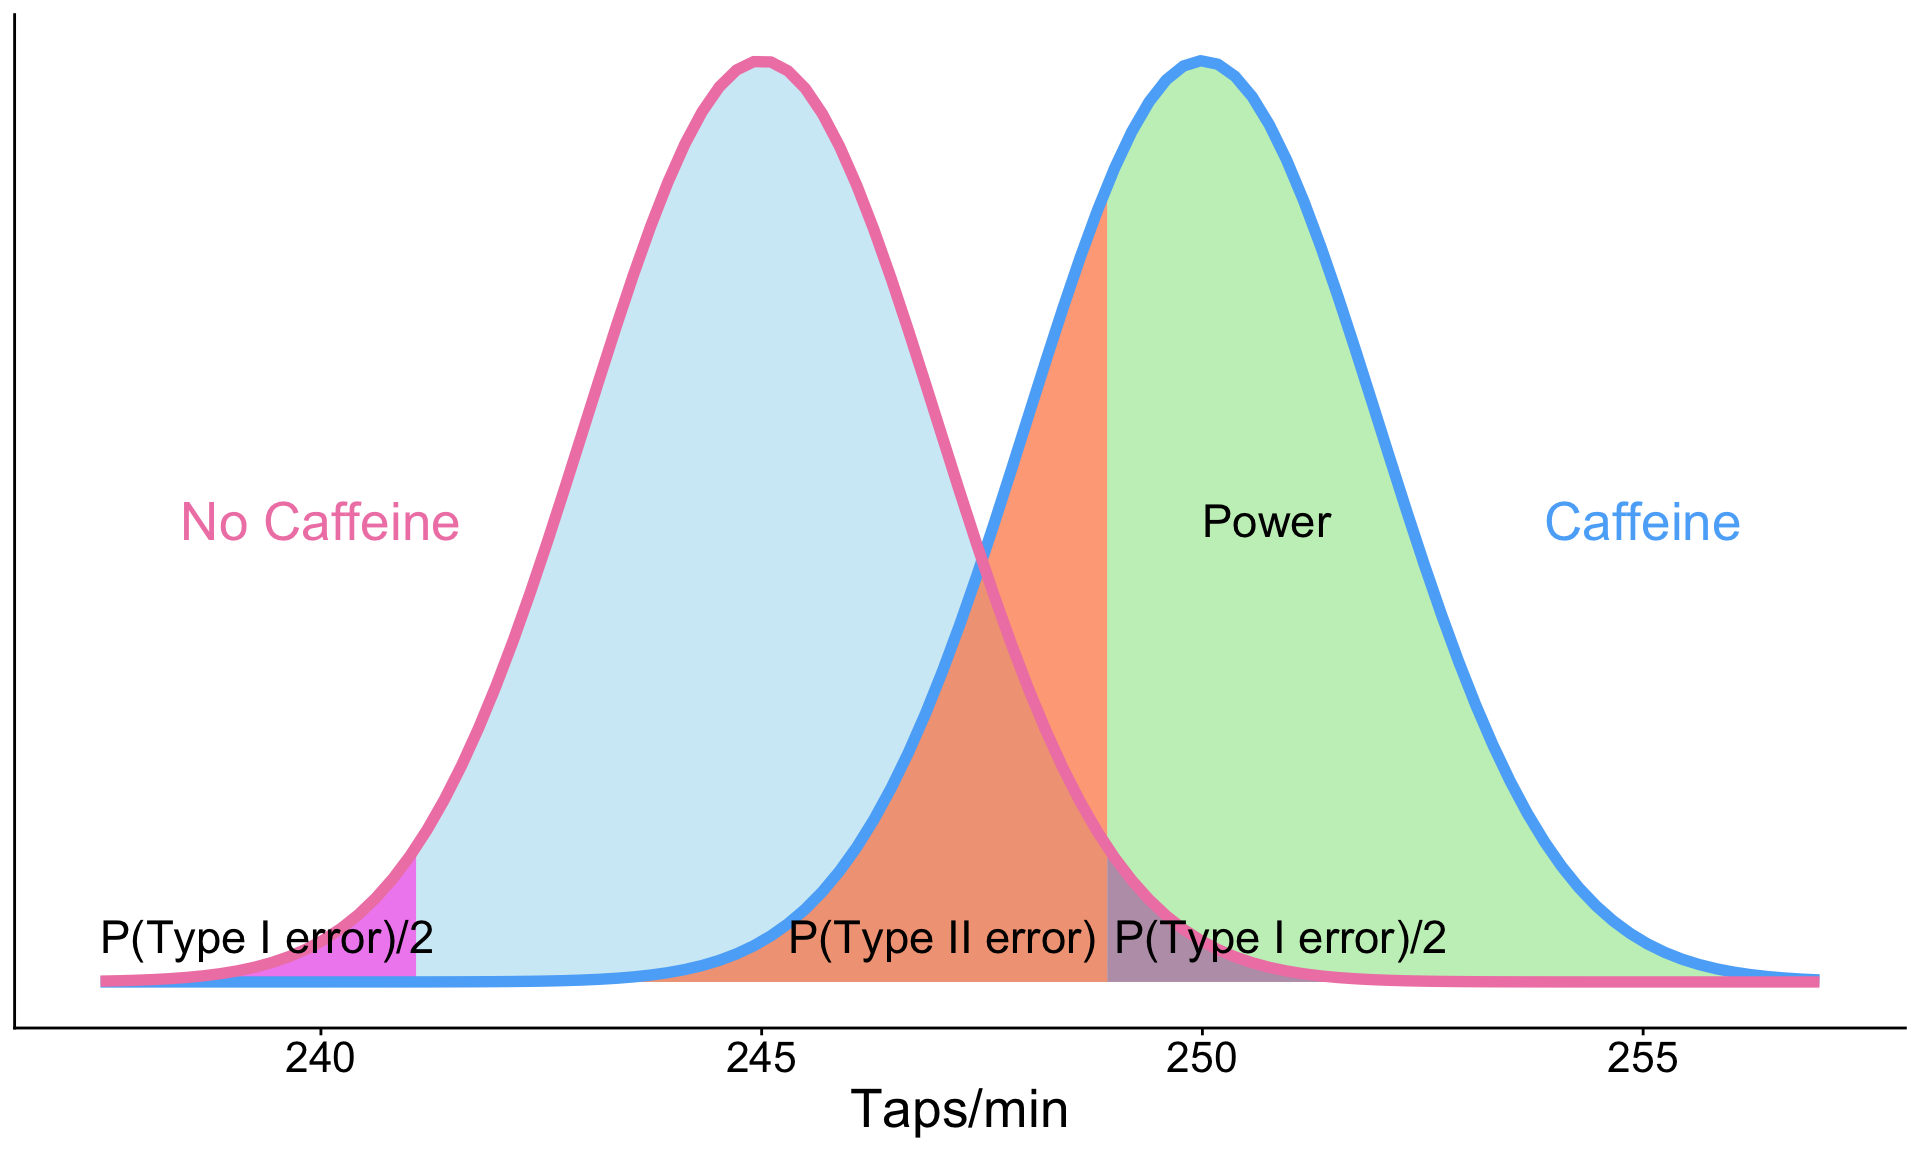
pwr: Two-sample t-test: sample sizeExample: Let’s revisit our caffeine taps study. Investigators want to know what sample size they would need to detect a 2 point difference between the two groups. Assume the SD in both group samples is 2.6.
Specify all parameters except for the sample size:
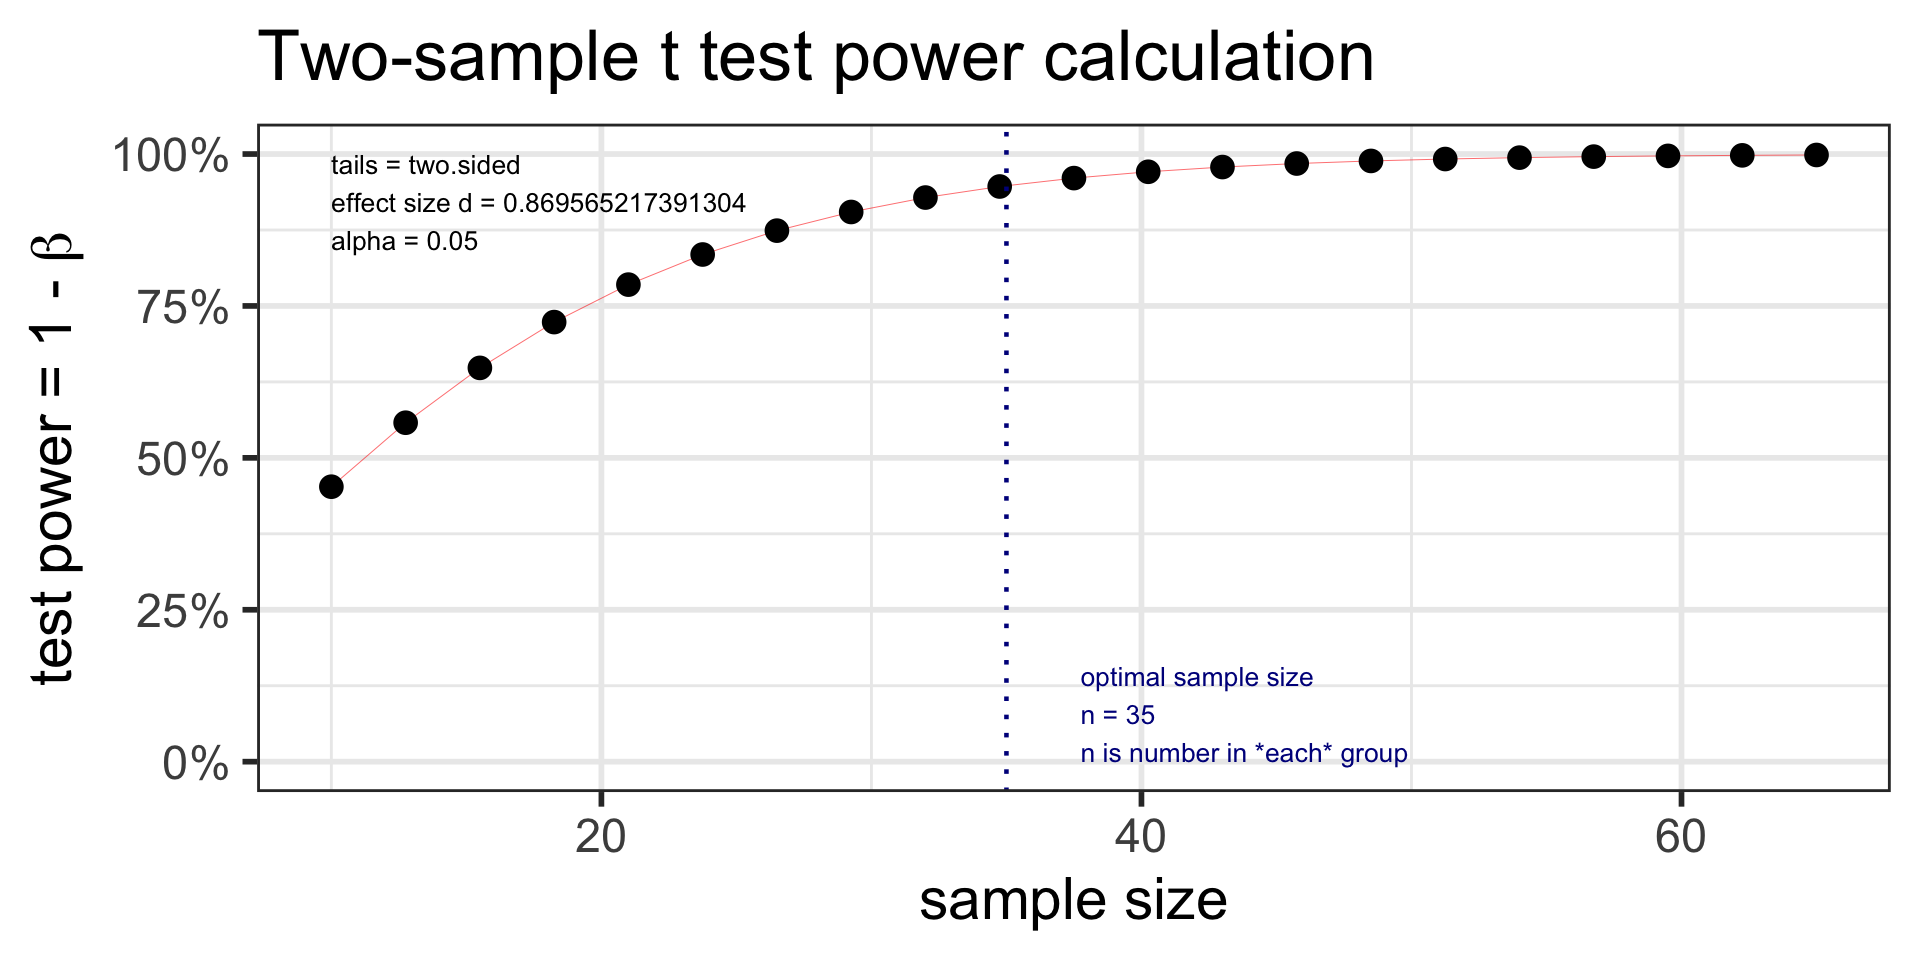
pwr: Two-sample t-test: powerExample: Let’s revisit our caffeine taps study. Investigators want to know what power they have to detect a 2 point difference between the two groups. The two groups are both size 35 (like in our previous example). Assume the SD in both group samples is 2.6.
Specify all parameters except for the power: