# A tibble: 6 × 4
  country      year  cases population
  <chr>       <dbl>  <dbl>      <dbl>
1 Afghanistan  1999    745   19987071
2 Afghanistan  2000   2666   20595360
3 Brazil       1999  37737  172006362
4 Brazil       2000  80488  174504898
5 China        1999 212258 1272915272
6 China 2000 213766 1280428583Data transformation: Widening data
Nicky Wakim
Tidy data1
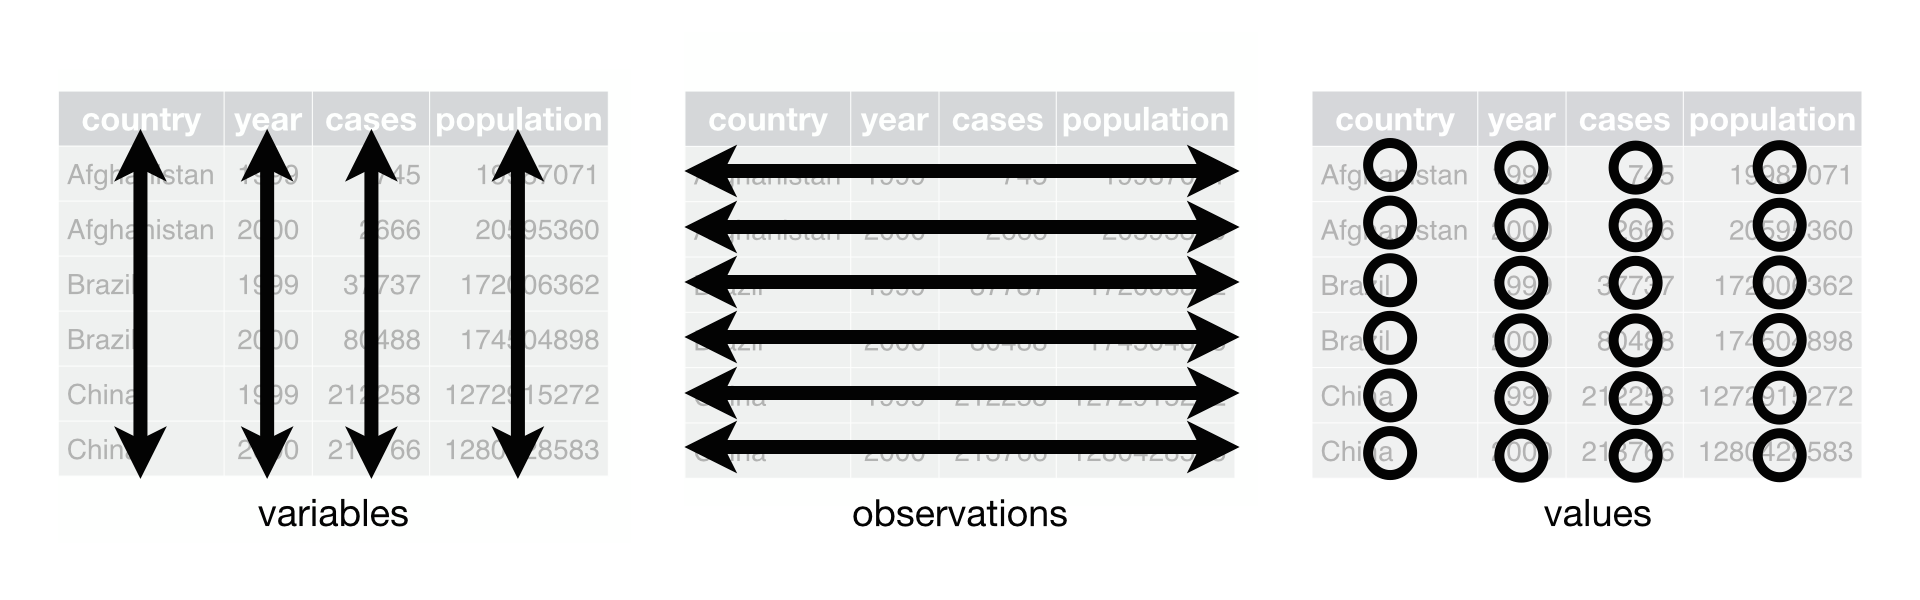
Each variable must have its own column
Each observation must have its own row
Each value must have its own cell
Let’s look at an example1 of data represented in different ways
We will look at a dataset measuring tuberculosis (TB) cases for different countries. We have information on the country, year, population, and number of TB cases:
Each column is one piece of information:
Population and cases are “types” of counts:
# A tibble: 12 × 4
   country      year type            count
   <chr>       <dbl> <chr>           <dbl>
 1 Afghanistan  1999 cases             745
 2 Afghanistan  1999 population   19987071
 3 Afghanistan  2000 cases            2666
 4 Afghanistan  2000 population   20595360
 5 Brazil       1999 cases           37737
 6 Brazil       1999 population  172006362
 7 Brazil       2000 cases           80488
 8 Brazil       2000 population  174504898
 9 China        1999 cases          212258
10 China        1999 population 1272915272
11 China        2000 cases          213766
12 China        2000 population 1280428583
We look at the rate of TB cases:
# A tibble: 6 × 3
  country      year rate
  <chr>       <dbl> <chr>
1 Afghanistan  1999 745/19987071
2 Afghanistan  2000 2666/20595360
3 Brazil       1999 37737/172006362
4 Brazil       2000 80488/174504898
5 China        1999 212258/1272915272
6 China 2000 213766/1280428583What do we do when our data are not tidy?
- In HRS data, let’s say we have data on many conditions
# A tibble: 15,453 × 5
   id         sex    age_yr condition       has_condition
   <chr>      <chr>   <dbl> <chr>           <chr>
 1 550015_010 Male       56 sleep_problems  No
 2 550015_010 Male       56 diabetes        No
 3 550015_010 Male       56 heart_disease   No
 4 550015_010 Male       56 lung_disease    No
 5 550015_010 Male       56 arthritis       No
 6 550015_010 Male       56 cancer          No
 7 550015_010 Male       56 stroke          No
 8 550015_010 Male       56 high_bp         No
 9 550015_010 Male       56 psych_condition No
10 550015_020 Female     49 arthritis       No
# ℹ 15,443 more rows
Current issue: Column has_condition has information on many conditions. Yes can mean a person has diabetes or lung disease.
The pivot_wider() function
- The
pivot_wider()function is used to widen data, which means it takes a couple columns and spreads the data across many columns.
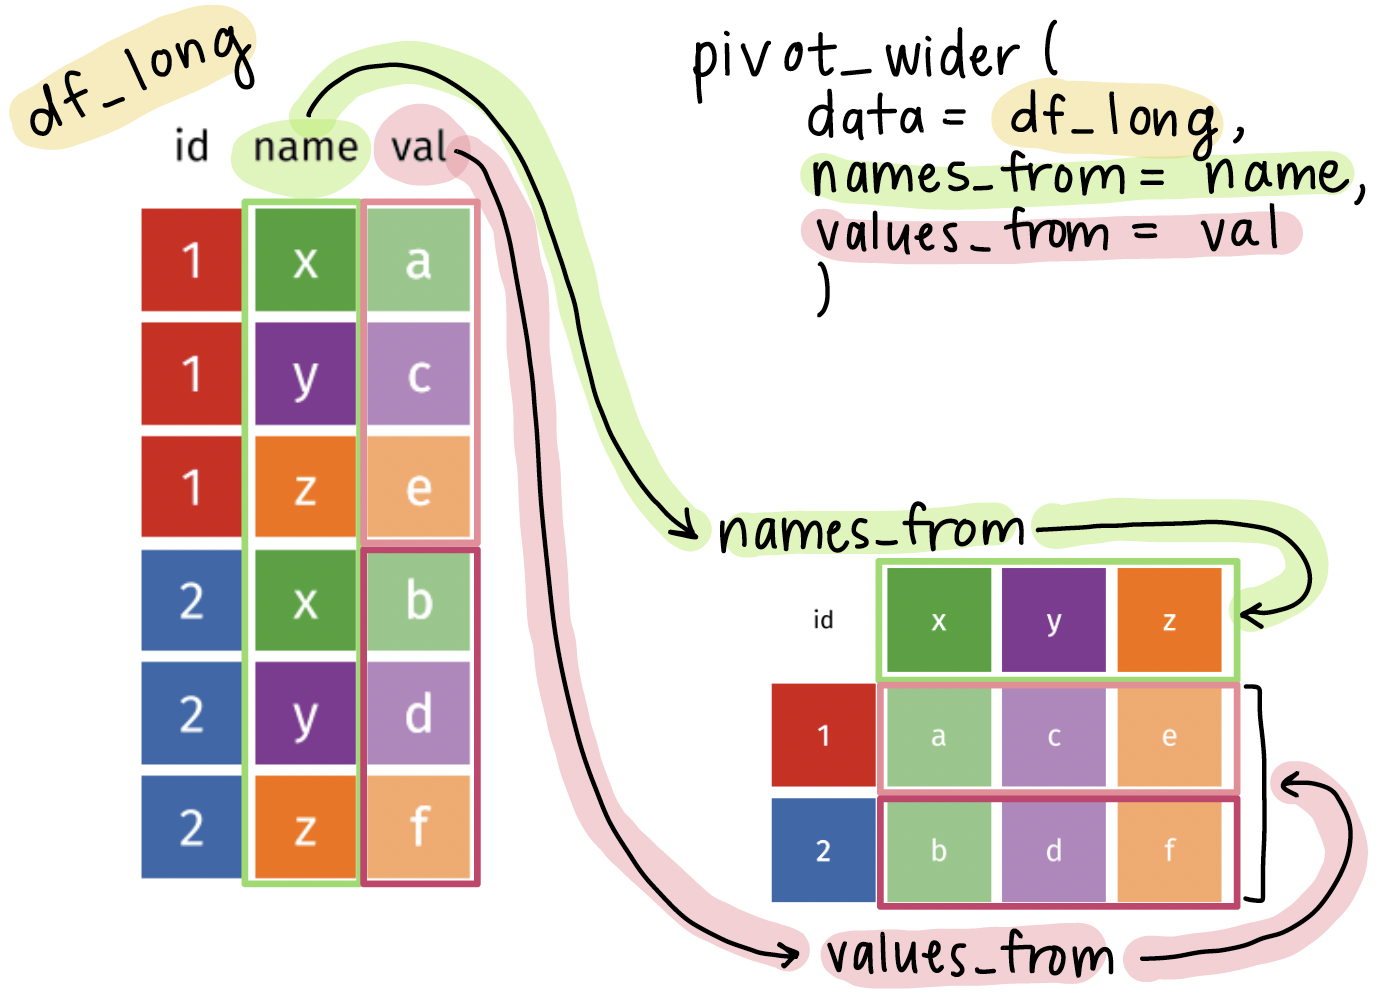
datawill usually be fed using the pipe operator (|>)names_fromspecifies the column that will be used to create new column namesvalues_fromspecifies the column that will be used to fill in the new columns with values
Visual of what pivot_wider() does
Using the pivot_longer() function on the HRS dataset
- We want to
- Keep the
idcolumn as is - Pivot the
conditioncolumn into new columns, one for each condition - Put all the values from
has_conditioninto the new columns
- Keep the
- 1
-
Feed
hrs_long_condinto thepivot_wider()function - 2
-
Use
pivot_wider()to specify the columns to pivot into wider format - 3
-
Use
names_fromto specify the old column (condition) that the new column names will be pulled from (e.g.,diabetes,lung_disease,heart_disease) - 4
-
Use
values_fromto specify the old column (has_condition) that the new column values will be pulled from (e.g.,Yes,No)
Note: In pivot_longer() we need quotes around the new column names, but in pivot_wider() we do NOT need quotes around the column names because they already exist in the dataset.
Let’s compare the before and after!
Original, long dataset:
# A tibble: 15,453 × 5
   id         sex    age_yr condition       has_condition
   <chr>      <chr>   <dbl> <chr>           <chr>
 1 550015_010 Male       56 sleep_problems  No
 2 550015_010 Male       56 diabetes        No
 3 550015_010 Male       56 heart_disease   No
 4 550015_010 Male       56 lung_disease    No
 5 550015_010 Male       56 arthritis       No
 6 550015_010 Male       56 cancer          No
 7 550015_010 Male       56 stroke          No
 8 550015_010 Male       56 high_bp         No
 9 550015_010 Male       56 psych_condition No
10 550015_020 Female     49 arthritis       No
# ℹ 15,443 more rows
New, tidy, wider dataset:
# A tibble: 1,717 × 12
   id         sex    age_yr sleep_problems diabetes heart_disease lung_disease
   <chr>      <chr>   <dbl> <chr>          <chr>    <chr>         <chr>
 1 550015_010 Male       56 No             No       No            No
 2 550015_020 Female     49 No             No       No            No
 3 550038_010 Male       53 No             Yes      No            No
 4 550041_010 Female     51 No             Yes      Yes           No
 5 550041_020 Male       51 No             Yes      Yes           No
 6 550043_010 Female     75 No             No       No            No
 7 550047_010 Male       54 No             No       No            No
 8 550063_010 Male       52 Yes            No       No            No
 9 550064_010 Male       56 No             Yes      No            No
10 550066_010 Female     80 No             Yes      No            No
# ℹ 1,707 more rows
# ℹ 5 more variables: arthritis <chr>, cancer <chr>, stroke <chr>,
#   high_bp <chr>, psych_condition <chr>
Notes: number of rows is 9 times shorter, each individual has 1 row of observations instead of 9 rows, each condition has its own column
Wrap-up
- We don’t always get data in the format we want
- Sometimes, it’s too long!
- The
pivot_wider()function is a great tool to help us transform our data into a tidy format
- This will help us a lot in grouping summaries and visualizations
Resources
- More information of the
pivot_wider()function can be found here
Data transformation: Widening data