Some words on Quiz 2, Lab 2, and Mid-term Feedback
2024-03-04
Quiz 2
Overall
- Great job!
- Just a few things to review
Question 2
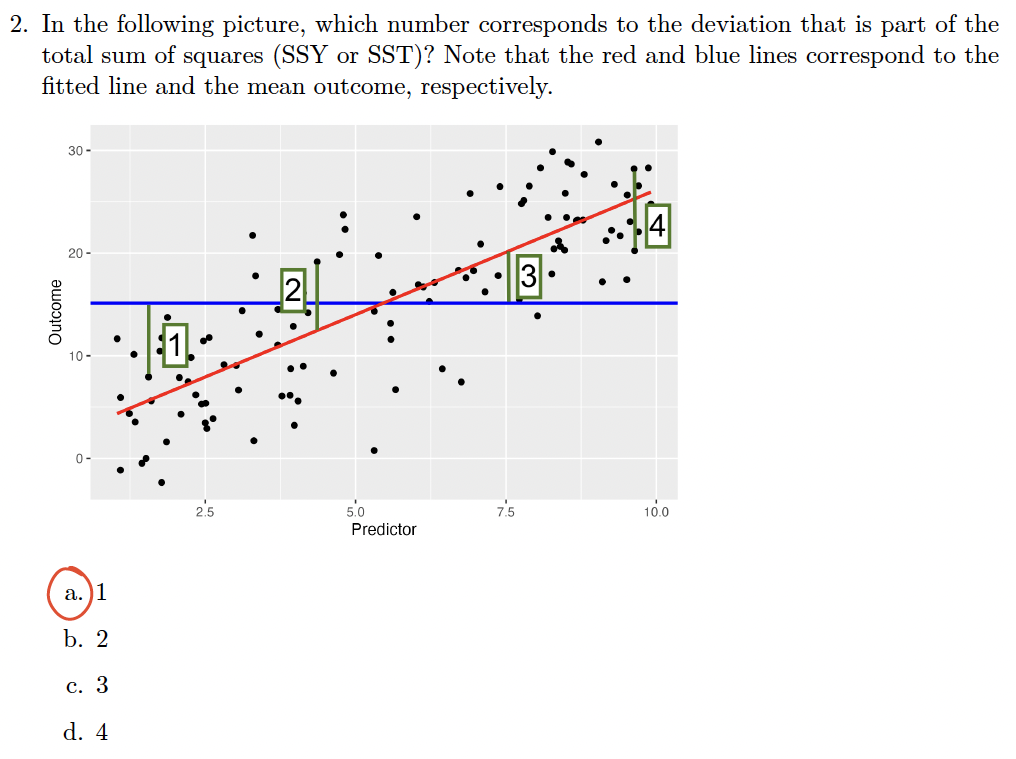
\[ SSY = SST = \sum_{i=1}^n (Y_i - \bar{Y})^2 \]
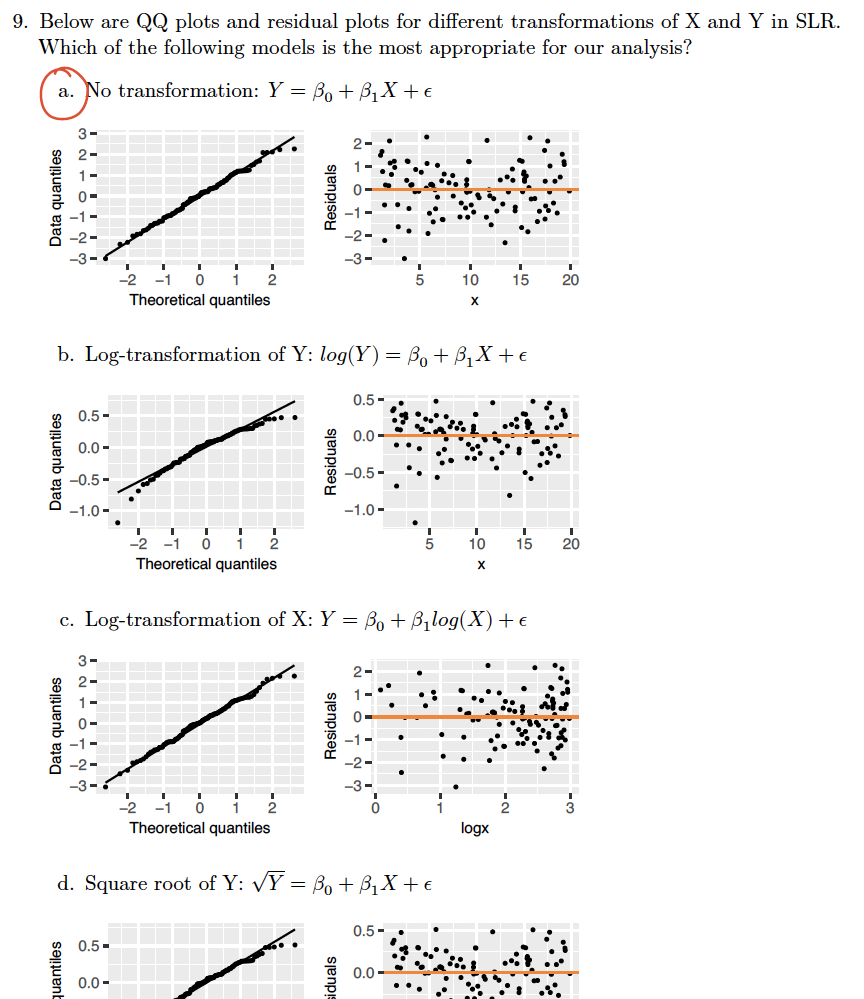
Question 9
Question 11
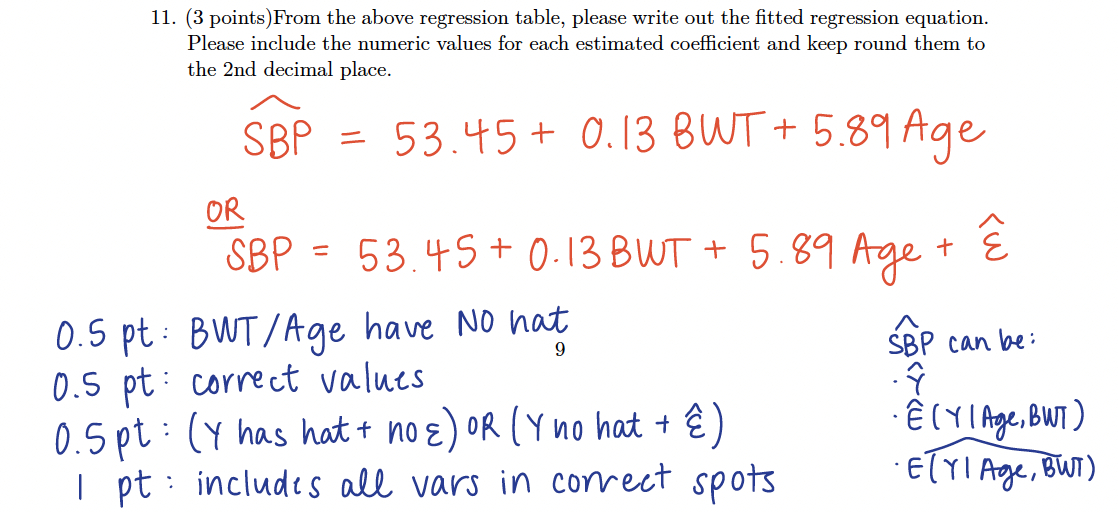
- Biggest mistake: not including the hat on SBP!
Question 12
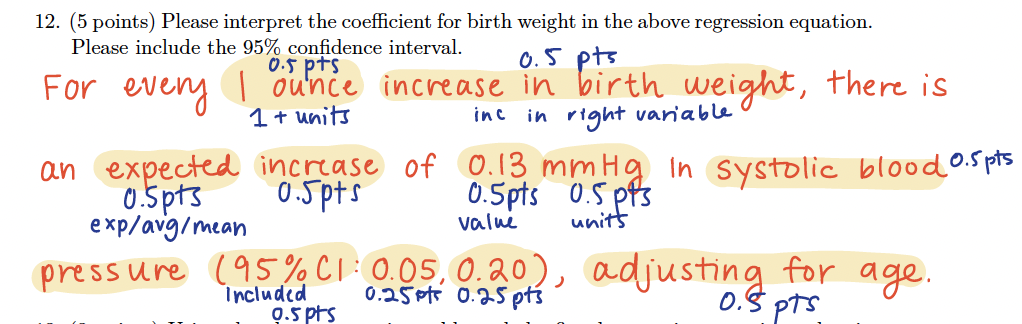
Biggest mistakes
- Not adjusting for age
- Forgetting units
Lab 2
Overall
Overall, good job! I feel like we’re making progress towards our analysis with thoughtful considerations for the data
I definitely steered us towards thinking about the defined population
Make sure you also think about over-representation
Over-representation does NOT mean we cannot make claims about the under-represented, but present, groups
When visualizing, making tables, displaying information from the data: always keep in the back of your mind:
What can a reader get from this if they have never seen the data?
Is it easy for the reader to understand the plot?
Does everything in the plot have a purpose?
Is the main thing I’m trying to communicate also the thing that stands out?
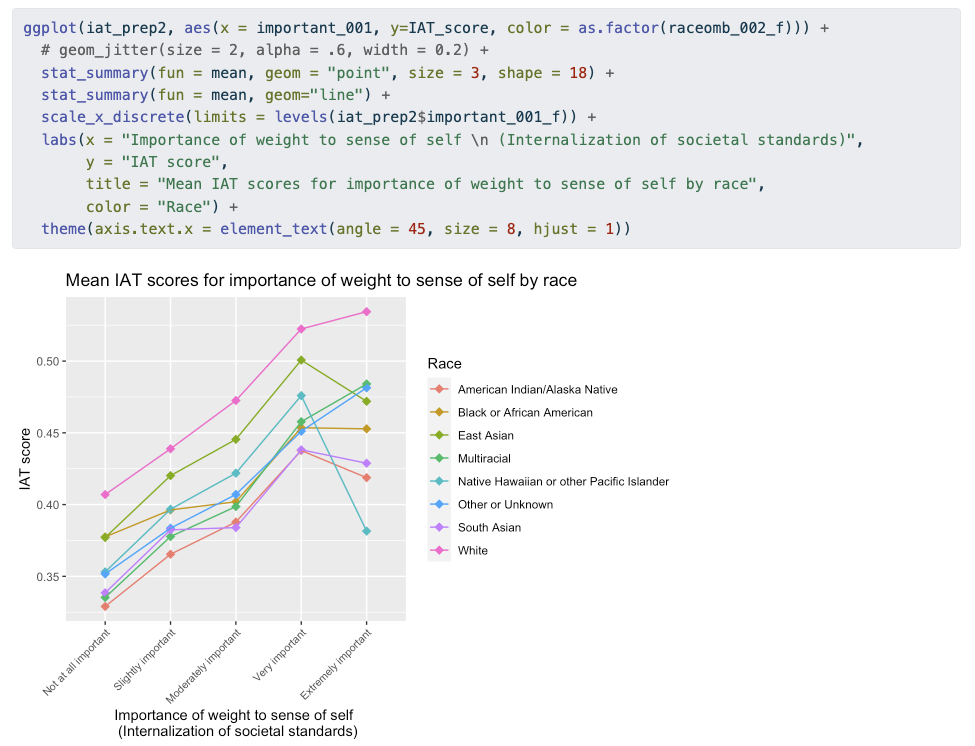
Bivariate visualization was supposed to visualize our research question
Notes on coding
#| message: falsePlease use after troubleshooting your code- Especially when loading libraries! Makes everything neater
When assigning category names, capitalization of the first word in each category is customary
Notes on coding/visualization
Did not take off, but ordering any categorical variables with inherent order is really helpful in our visualizations
- Also, tilting category names is helpful!
Notes on interpretations/considerations
Remember that multiple linear regression will adjust for variables outside of our research question!
- So we either adjust with a main effect or an interaction!
How should a plot look?
How should a table look?
Mid-term feedback
Overall
Only 29 names recorded: should be in gradebook now
Appreciate your feedback
I will try to address some of these
- Balancing bandwidth, equity, different opinions, and things that are just a consequence of me teaching the course for the first time
Still seeing what I can change ASAP
In-class (1/2)
Sometimes my own explanations get confusing - would prefer if I revisited topics later rather than going through bad explanation
- Fair enough: a few things over the quarter that I have taken for granted that I can riff a solid explanation, but I cannot
Lecture notes in PDF: go to github, and I will have a PDF version there by the start of class
Pace of class: mixture of opinions
Exit tickets: some people don’t like them, some do, repetitive
I made all the questions optional now - so fill it out or not, but this is my way of keeping a pulse on how effective lecture was
And this will still be my way of making sure we are staying with the course materials
I view this as an easy way to earn points that take weight away from higher stakes assignments
Datasets: some like that we have one dataset, and some want more
- Next quarter: have ~2 quarter long datasets (highly dependent on my course load next quarter)
R code: mixture of opinions
- Less/more, too much time explaining/too little time explaining
In-class (2/2)
Poll everywheres: mixture of opinions
- My main goal: give you all a “productive” break from me lecturing you
More real world examples to demonstrate concepts
More structure to lectures - wrapping up concepts, learning objectives
Lectures: scrollable html option?
Towards beginning of course: mistakes in slides and due dates
Homework
Feedback on HW would be great
Posting earlier: for this quarter - I just don’t have time :(
Referencing a TB in homework and in class: some confusion if you need to read it on your own
You don’t!
I am mostly referencing these things for copyright issues because I am publicly publishing our slides, homeworks, labs, etc.
Quizzes
Some like the format, some don’t
We like the open note
Some: more of a test if you can search through the slides
Options for quizzes: we can brainstorm for next quarter
- Ultimately, I have to balance time, cheating, equity of take-home
Labs / Project
Would be nice to have a lab section
Labs divided into smaller chunks
- Balancing with homework assignments
Things we like
Notes with annotations and recording
- Option for asynchronous viewing, in-person attendance not required
Engaging lectures (for some)
- “…slides are my best friend.”
Descriptions in multiple ways, learning types
Concepts then code
Flexibility
Easy to understand terms when explaining
Judgement free zone
Final words
Saw a few students discuss how the volume of work this quarter is giving them anxiety, making them feel inadequate, etc.
I understand and have experienced the same feeling - not saying any of us should experience it
Keep going! Your grades are not your worth! You belong here! I want you to succeed!
Finally, you are LEARNING!
You will get things wrong. Hopefully you and your professors are giving you some grace.
I am still learning! I still reference things from my old classes
- It’s all about setting a foundation so that you know some things and know how to reference materials/internet/books to fill in gaps
If I missed anything important to you in your feedback, please share in the anonymous on-going feedback
Quiz and Lab 2