Week 8
On Wednesday, 5/22, we will be in RPV Room A (1217)
Resources
| Lesson | Topic | Slides | Annotated Slides | Recording |
|---|---|---|---|---|
| 14 | Model Diagnostics | |||
| 15 | Model Building |
Announcements
Monday 5/20
HW 4 part d UPDATED!!
- Help from Monday class on Part e
Homework 3
Remember to include the indicator function for different categories of your variables!!
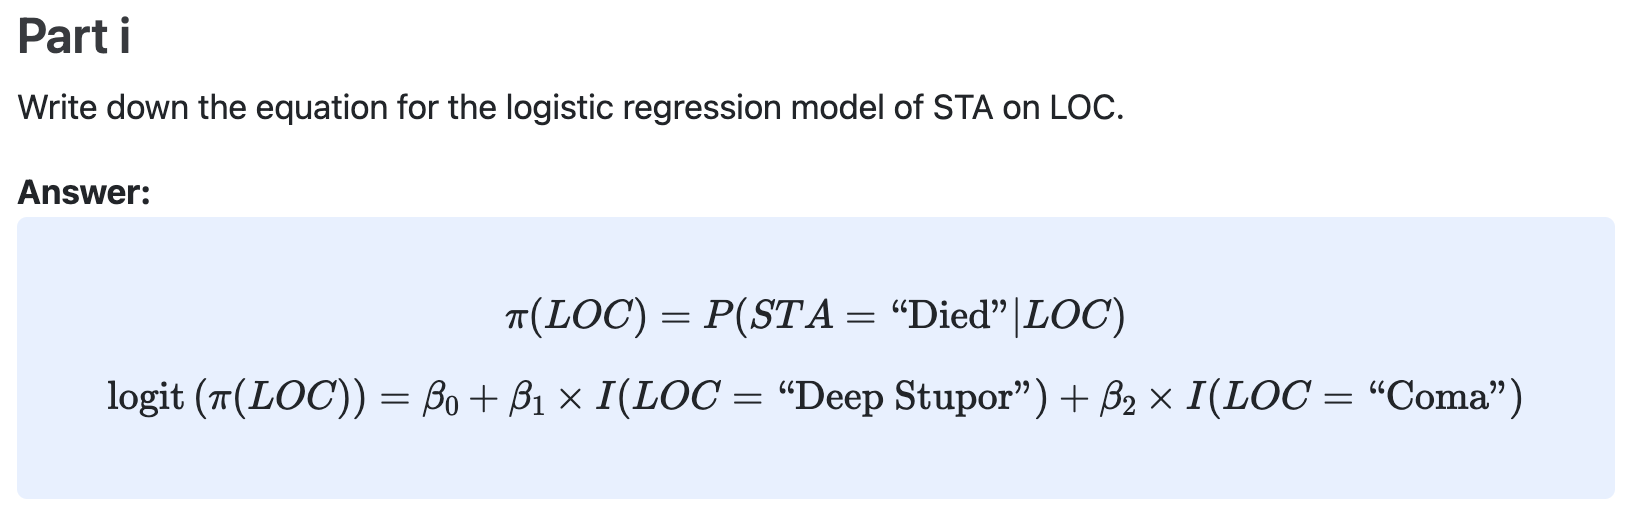
LOC has three levels: there should be two indicator functions and two coefficients for this variable!!
Wednesday 5/22
Lab 3
When interpreting ORs…
You all are correct by including as much detail about the covariate as possible
For example: If I was using
UNMETCARE_Yand I wrote “The estimated odds of food insecurity for individuals who needed medical care in the last 12 months but could not get it because they could not afford it…”This is correct!
BUT within our longer written report, we should define “unmet care” earlier on. Thus, once we get to interpreting ORs, we can just say “unmet care.”
Also, correct for including a list of the variables that you are adjusting for!
But again, we hopefully defined our final model and specifically mentioned the variables that we are adjusting for
Thus, once we get to our interpretation, we can say something more like “adjusting for the previously listed variables in our model”
For output of `tbl_regression()` make sure to edit the variable names into more common language
set_variable_labels()from tibbleOne package might help!
Class Exit Tickets
Muddiest Points / Questions
1. How did you determine the ages for the R output on slide 24 (standardized deviance residuals)
The centered ages are centered around the mean age. A few classes ago I mentioned that the mean was 69 years old, might have gotten lost in this lesson. So calculating the actual ages is just adding the mean age and centered age. So centered age of 6 is 69+6 = 75. Also, very confusing because apparently I can’t add!
2. From comment on shrinkage vs. regularization vs. penalized methods
All these terms are used intercahngeably!
Penalized regression means that penalty is added to our likelihood function! This may feel like a more generic form of shrinkage or regularization. However, within statistics, I do not see penalized regression used for anything other than minimizing the coefficient values towards zero. I often see it defined as: form of regression that uses a penalty to shrink coefficients towards zero.
Definitions of regularized regression mirror the above for penalized regression.
Shrinkage is more the action of reducing coefficient values towards zero. Many people will refer to regularization and penalized regression as shrinkage methods.
- LASSO, ridge, and Elastic net are all types of penalized/regularization/shrinkage methods
3. Sign column within vi() output
The sign column is in fact the sign of the coefficient within the model.
So within our interaction model, the sign for smoking status is negative. Since smoking status had many interactions, we cannot make claims about the association between smoking and fracture without considering all other variables that it interacts with. ALSO, remember that our goal here is prediction, NOT association.