Week 5
- Class will be over Webex on 10/25
- You can join from your personal computer synchronously, together in the classroom synchronously , or asynchronously on another day
- If you join in the classroom, you can press “Join Webex” on the touchscreen thing in the room, then start typing “wakim@ohsu.webex.com” My personal room should come up for you to join.
Resources
| Chapter | Topic | Slides | Annotated Slides | Recording |
|---|---|---|---|---|
| 12 | Variance of discrete RVs | |||
| 13 | ||||
14 15 16 19 20 |
Bernoulli RV Binomial RV Geometric RV Hypergeometric RV Discrete Uniform RV |
For the slides, once they are opened, if you would like to print or save them as a PDF, the best way to do this is:
- Click on the icon with three horizontal bars on the bottom left of the browser.
- Click on “Tools” with the gear icon at the top of the sidebar.
- Click on “PDF Export Mode.”
- From there, you can print or save the PDF as you would normally from your internet browser.
On the Horizon
Class Exit Tickets
Additional Information
Announcements 10/23
Flipped classroom question
Results leaned towards keeping class as is
After midterm, I will post Meike’s videos before our in-class time
Hoping this is decent compromise for those of you who wanted more of a flipped classroom
Office hours for this whole week are cancelled
- Between my conference and a weekend trip, I won’t be able to hold office hours this week
On the Monday and Tuesday before the exam, I will hold virtual office hours
Monday, 10/30, 4-5pm
Tuesday, 10/31, 1:30-2:30pm
If you cannot make those hours and want to ask me questions, we can set up a short meeting for Monday or Tuesday
I will also not be able to grade HW 4 until Monday (10/30)
- I will post the solutions and videos for HW 4 on Friday (10/27)
Exam info!!
- Covers materials up to Chapter 11 / Homework 4!!
- See more exam info (including review problems) on the Week 6 page
Announcements 10/25
Homework 5 due date moved to 11/9!!!
- Since HW5 material will not be on the test, it seems a little odd to have you turn it in the day after our midterm
Exam info
Below are my current instructions for the exam. Are there any questions?
Instructions
I have written a “45 minute” exam. However, you have the full class period from 10:35am - 12pm.
The exam is open book and open notes. You may use books other than the class textbook, you may anything on our course webpage, and you may use reference websites (like Wikipedia, Googling expected value of specific distribution, etc.).
No cheating will be tolerated. This includes:
Using ChatGPT
Using question and answer threads typically seen on sites like StackExchange, WikiHow, Quora, Reddit, StackOverflow, Chegg, etc.
Asking other students in the room or looking at other students’ exam work.
You must show work to receive full credit. If you have a correct answer, but no work, you may not receive full credit. “Work” can include:
Writing your internal narrative for why you made a certain calculation
Writing where you got a number from
Writing the formula for something you calculate
Writing the property that you used to get from one step to another
Statistician of the Week: Liz Hare

Dr. Hare got her BA from Bryn Mawr College and her PhD in Genetics (1998) from The George Washington University. She works primarily in dog / animal genetics; although, as a quantitative geneticist her statistical and computational methodology is quite sophisticated.
Dr. Hare is active in the MiR (Minorities in R) Community which aims to support historically underrepresented R users around the world.
Topics covered
Her computational language of choice is R, and much of her work has focused on open science with an eye toward inclusion and equity. In many software programs, the user has the ability to include alt text: text descriptions that convey the content and meaning to blind and low-vision readers.
you really need to tell us what the data is saying and why you included it.
- What kind of graph or chart is it?
- What variables are on the axes?
- What are the ranges of the variables?
- What does the appearance tell you about the relationships between the variables?
Relevant work
- L. Hare, Writing Alt Text to Communicate the Meaning in Data Visualizations, Do No Harm Guide: centering accessibility in data visualization, eds Schwabish, Popkin, Feng, Chapter 4, 2022.
Outside links
Please note the statisticians of the week are taken directly from the CURV project by Jo Hardin.
Muddiest Points
1. Ghost problem with and without replacement
Coming soon.
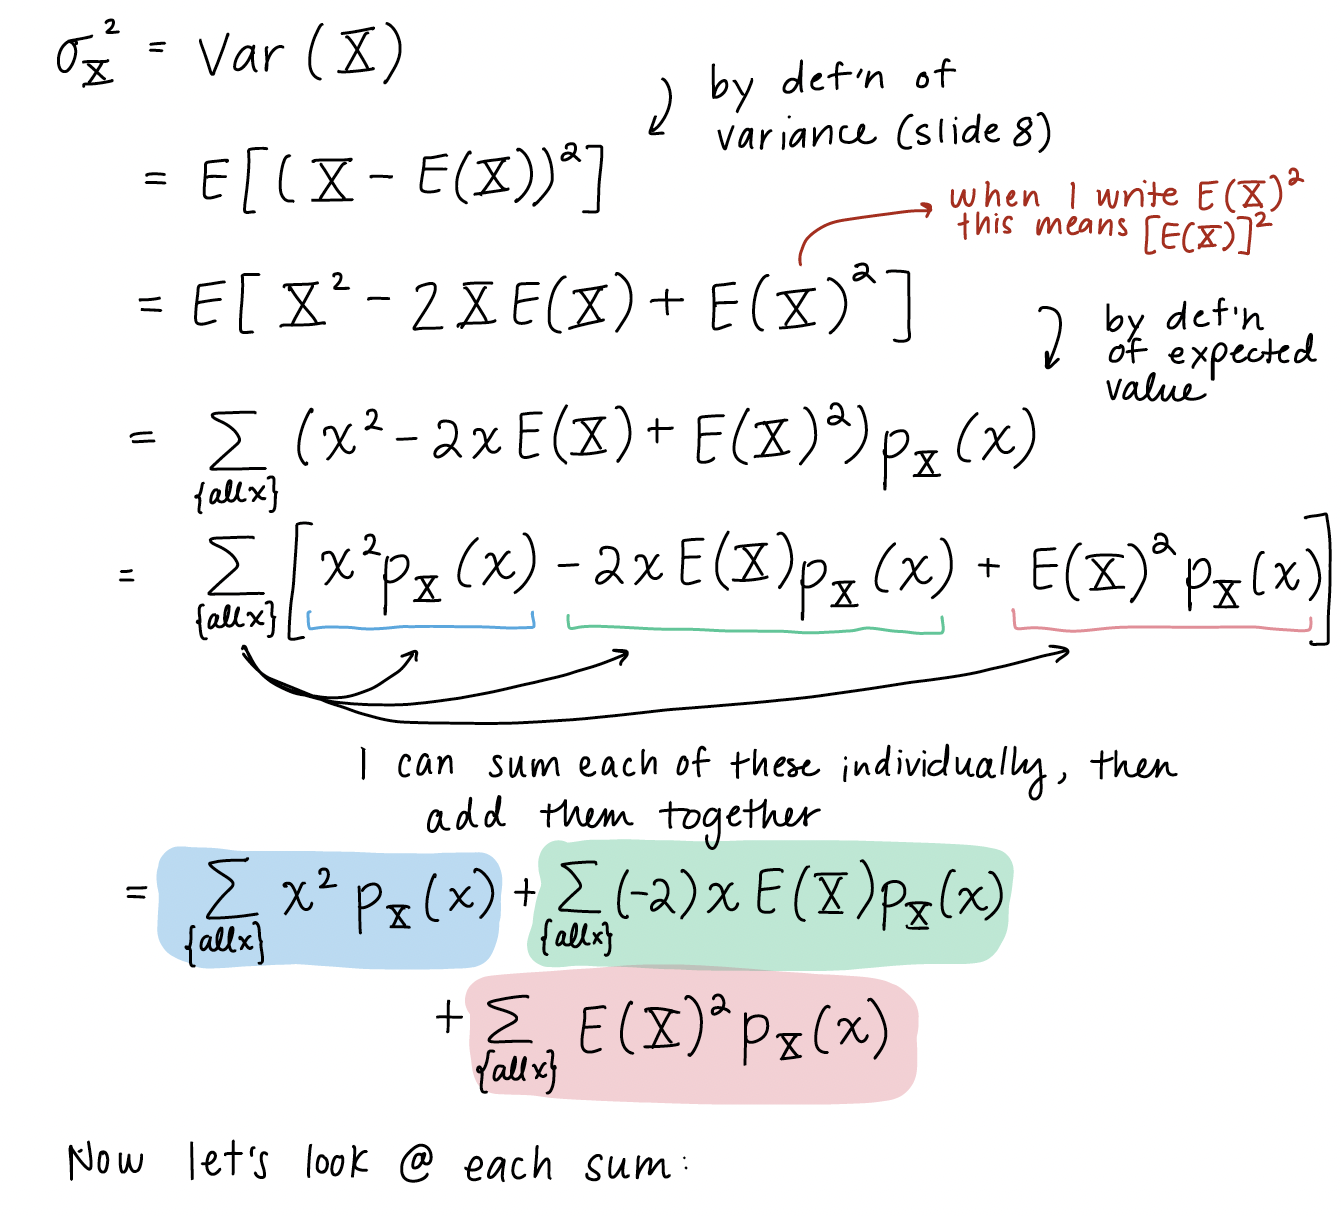
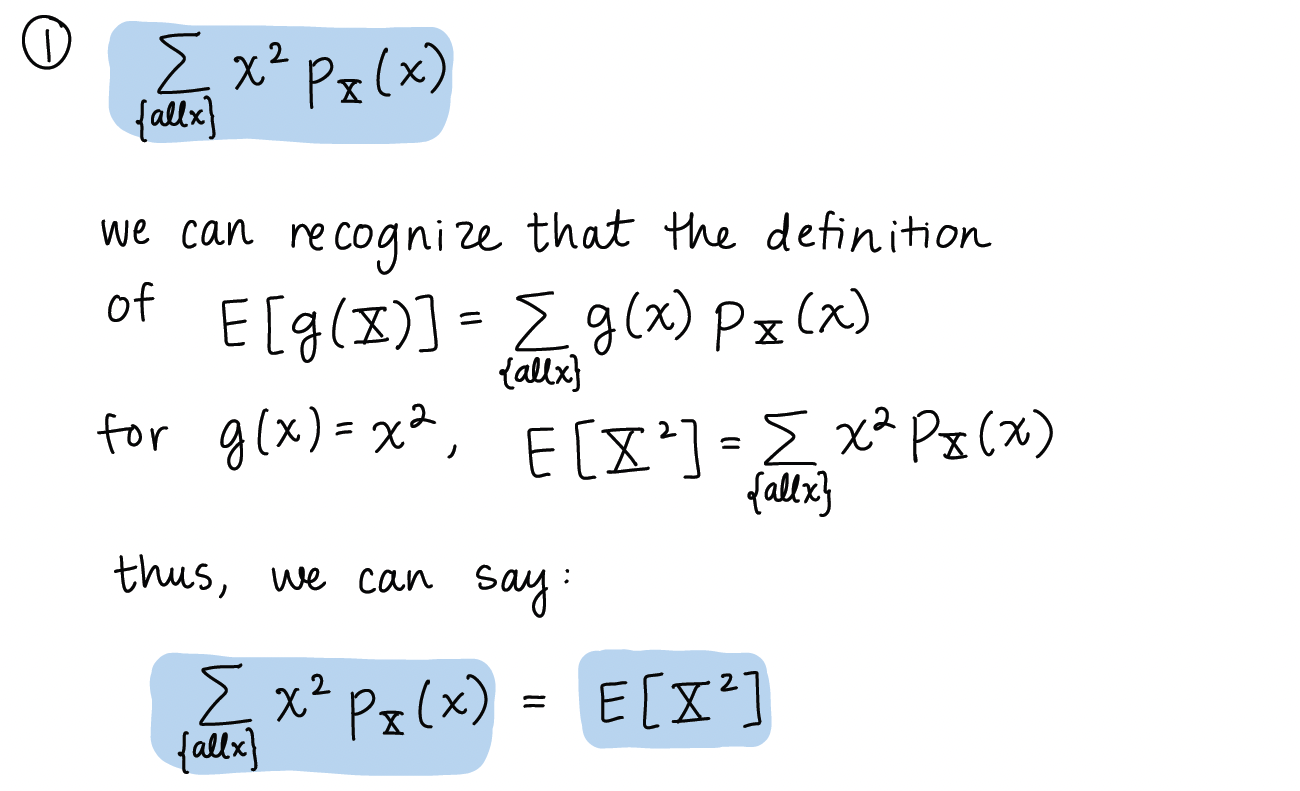
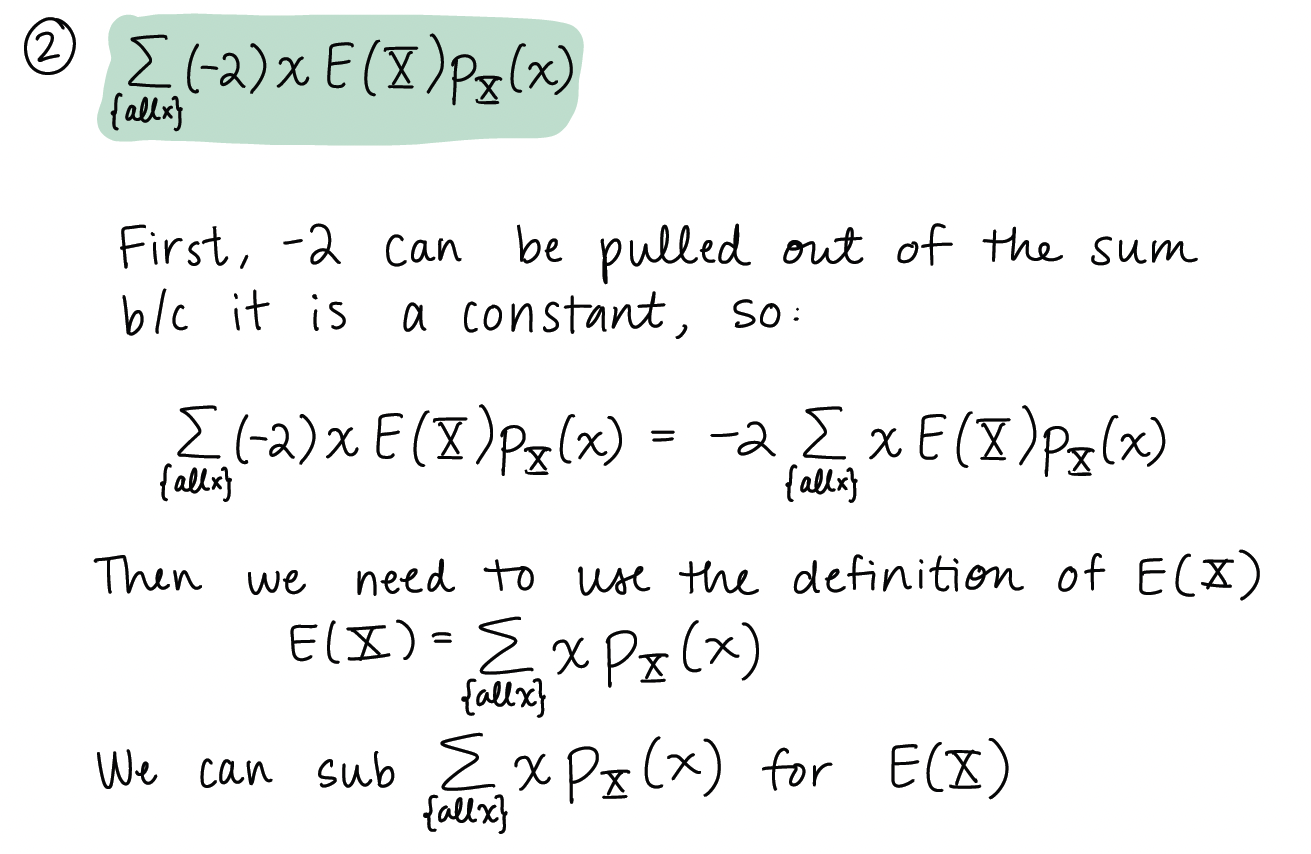
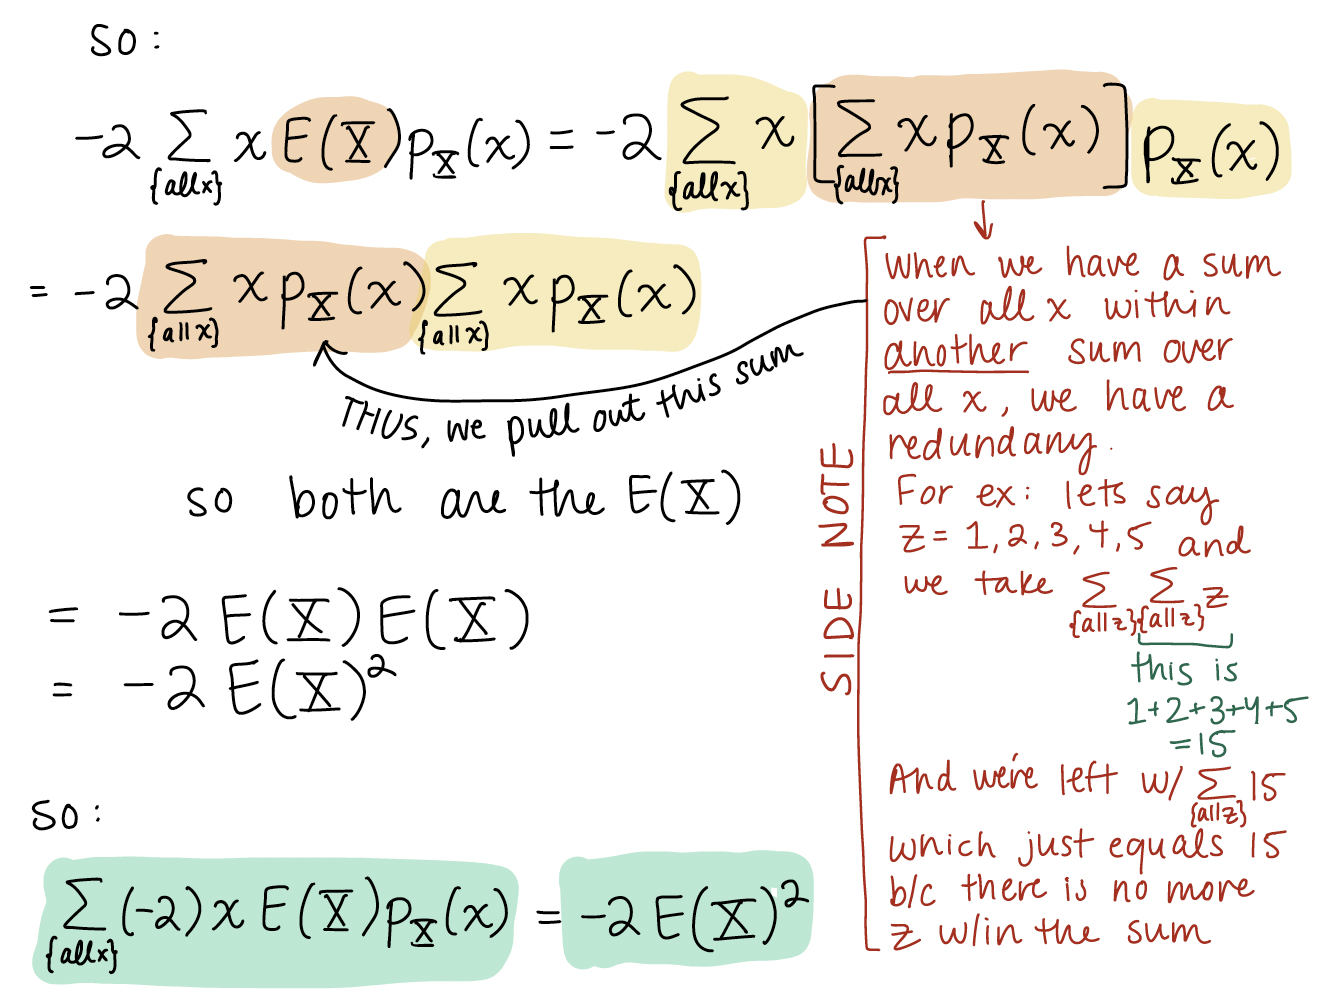
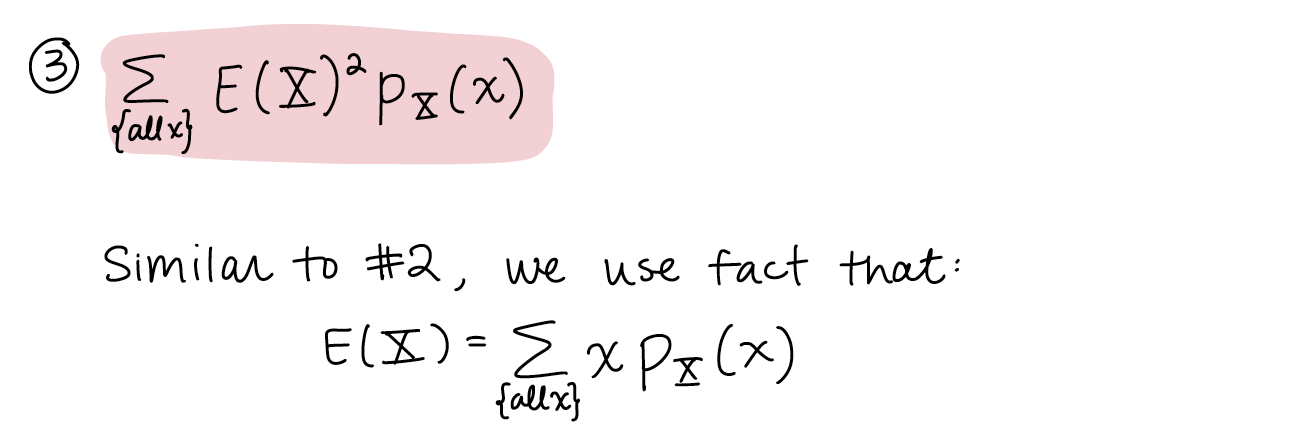
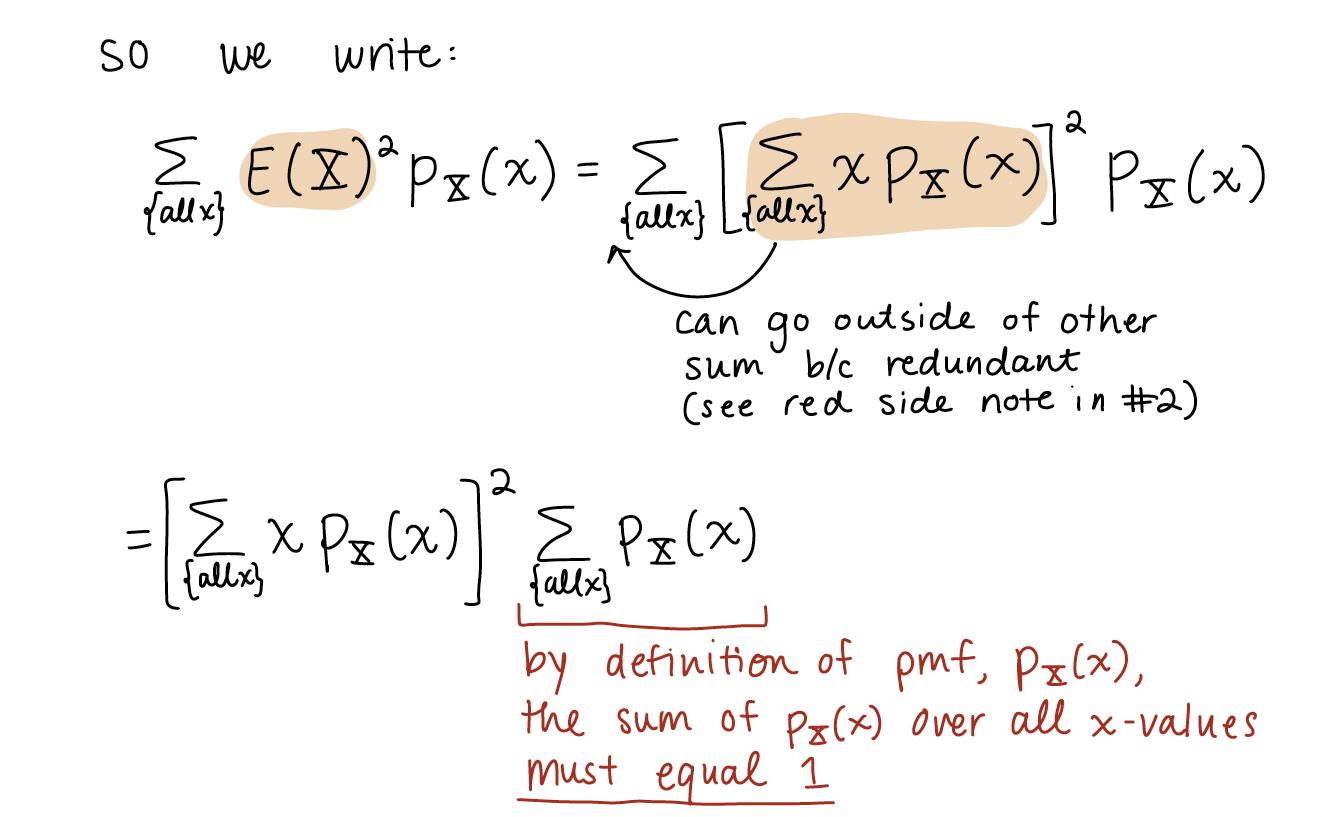
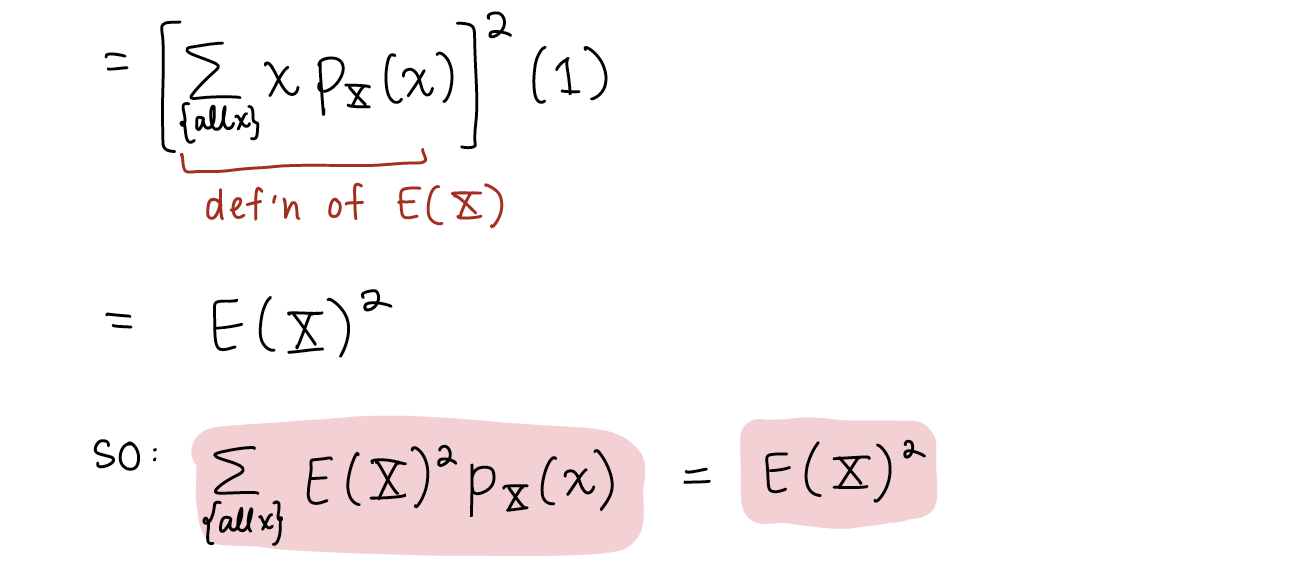
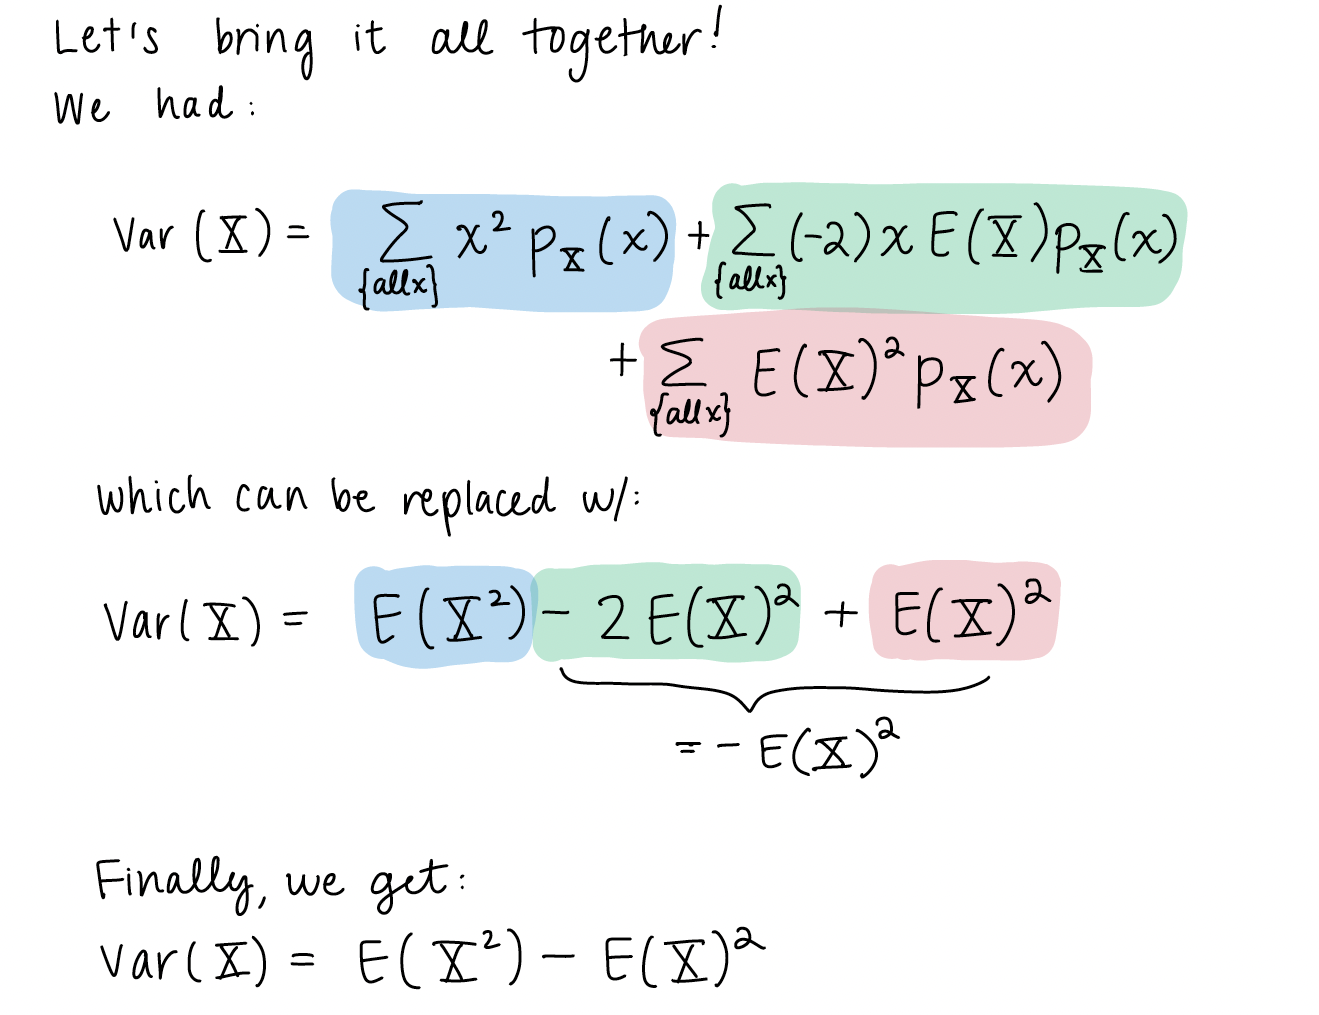
2. Proof of variance formula
Here is the variance formula that we worked through on slide 9 of Chapter 12’s notes.
I stepped through this quite quickly and made some implicit steps. So let’s revisit it with explicit steps!
3. What progression are we following in the course??
Someone asked if this is our progression: RV is function \(\to\) Expected value is function to describe mean of RV \(\to\) Use functions within expected value to set up variance
Basically, yes! The random variable is a function of a random process. The RV inherits that randomness.
From there, we’ve been working towards calculating the probability of a realized value ($x$) of the RV. The probability can be different for different realized values (as it links back to the random process).
We also want to construct ways to describe our random variables. We may want to figure out what to expect from our random variable (which translates to the mean value of the RV). Since our RV is rooted in a random process, we may want to get an idea of how spread out our realized values are. We use our expected value (mean) as an anchor in our spread. Variance is one way to measure this spread.