Week 7
With homework 5, you need to complete the midterm survey. This will help me evaluate how well I am teaching.
There are 13 total questions. Only one question is required, so if you do not feel strongly or do not have suggestions, don’t feel like you need to answer. I want to hear your opinion! I want to make meaningful changes in the classroom that will help you!
Don’t forget that this is 2% of your grade. This survey is also due November 9th at 11pm.
Resources
| Chapter | Topic | Meike’s video | Slides | Annotated Slides | Recording |
|---|---|---|---|---|---|
| pre-24 | Calculus Review | ||||
| 24 | Continuous RVs and PDFs |
Meike’s: |
|||
| 25 | Joint Densities |
Meike’s: |
For the slides, once they are opened, if you would like to print or save them as a PDF, the best way to do this is:
- Click on the icon with three horizontal bars on the bottom left of the browser.
- Click on “Tools” with the gear icon at the top of the sidebar.
- Click on “PDF Export Mode.”
- From there, you can print or save the PDF as you would normally from your internet browser.
On the Horizon
Announcements on 11/6
SPH Student Leadership Council elections!
Faculty can nominate students
Anyone interested?
Student access to Vanport
Floors 5 and 6: M-F 8am - 5pm
Computer lab on 2nd floor: M-F 8am - 8pm
Portland Public School teacher strike
- If you are affected by this, please let me know! You can let me know ASAP or as you need accommodations.
No Friday coffee hours (11/10)
HW 4 Grading
Feedback will be delayed as I grade the test
Everyone turned it in!
Midterm grading
I am sorry for how difficult question 3 turned out
- I was testing you on too many things at once
Graded 3 out of 4 problems
I don’t want to make any promises because I have not looked at the full test, but I am considering options
Don’t forget the Midterm (mid-quarter) feedback!!
Class Exit Tickets
Additional Information
Statistician of the Week: W.E.B. Du Bois
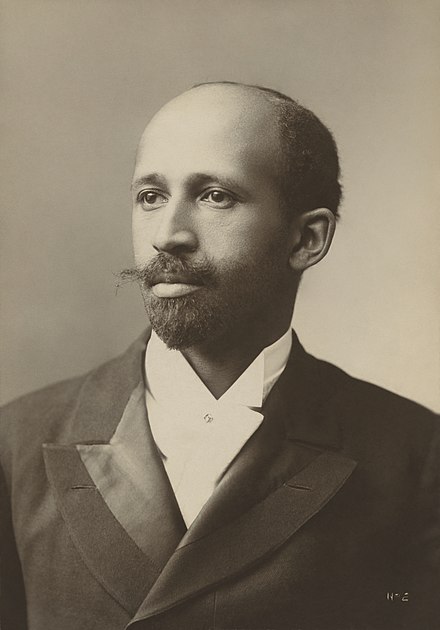
Du Bois was a sociologist and among the earliest data scientists. As Battle-Baptiste and Rusert say, his work can be thought of as
the rendering of information in a visual format to help communicate data while also generating new patterns and knoweldge throughout the act of visualization itselt.1
Topics covered
Du Bois was a sociologist who contributed to the field of data visualization through infographics related to the African American in the early twentieth century.
Relevant work
- Rusert, B., and Battle-Baptiste, W. “W. E. B. Du Bois’s Data Portraits: Visualizing Black America”, Princeton Architectural Press, 2018. https://papress.com/products/w-e-b-du-boiss-data-portraits-visualizing-black-america
Outside links
- Wikipedia
- TidyTuesday data viz and TidyTuesday challenge provided the data needed to re-create most of Du Bois’s original graphs (his originals were drawn by hand).
- Data Journalism in the study of W.E.B. Du Bois
- W.E.B. Du Bois: retracing his attempt to challenge racism with data
- W.E.B. Du Bois’ Visionary Infographics Come Together for the First Time in Full Color
Other
In 1900 Du Bois contributed approximately 60 data visualizations to an exhibit at the Exposition Universelle in Paris, an exhibit designed to illustrate the progress made by African Americans since the end of slavery (only 37 years prior, in 1863).
At their core, the data visualizations advocate for African American progress. They not only speak to the progress that had been made, but they centered many of the challenges that continued to exist at the time. The set of visualizations demonstrate how powerfully a picture can tell 1000 words, as the information Du Bois used was primarily available from public records (e.g., census and other government reports).
Whitney Battle-Baptiste and Britt Rusert have reproduced and narrated the images from the exhibit in W.E.B. Du Bois’s Data Portraits: Visualizing Black America, the color line at the turn of the twentieth century.
Please note the statisticians of the week are taken directly from the CURV project by Jo Hardin.
Muddiest Points
1. Why we are allowed to “split” the operator d/dx into two pieces as if it were a fraction when it’s an operator
Here is a pretty helpful StackExchange post talking about this!
2. How to know what to use as \(u\) and \(dv\) for integration by parts
I have two approaches to identifying \(u\) and \(dv\):
Try to find a \(u\) that will eventually differentiate into a constant. This usually works unless you’re left with a \(dv\) that is hard to integrate.
For example, \(u=x^6\). the first derivative, \(u'=6x^5\), which may lead us to do another integration by parts, but eventually, at the 6th derivative, we get 720. This means, in our integration by parts, we eventually get an integral that only has \(x\) in the function once.
- In this example, \(x^6\) would result in many integration by parts. I feel like we don’t typically see that many in our work.
In Example 3.5 in Calculus Review, setting \(u=x^2\) is a bad idea because we don’t really know how to integrate \(dv=ln(x)\) into \(v\).
Try to find a \(u\) where \(du\) is the reciprocal of \(v\) or \(du\) cancels with \(v\).
- Look again at Example 3.5 in the notes! Hint: What is the derivative of \(ln(x)\)? And what does \(\dfrac{1}{x}x^3\) equal?
3. Looking for more practice in calculus?
I just stumbled upon this website! Just a bunch of calculus practice problems! Might be some help.
Footnotes
Battle-Baptiste and Rusert, W.E.B. Du Bois’s Data Portraits: Visualizing Black America, the color line at the turn of the twentieth century, 2018, page 8.↩︎